Mise en page de l'arbre généalogique avec Dot / GraphViz
j'essaie de dessiner un arbre généalogique avec Dot et GraphViz.
c'est Ce que j'ai actuellement:
# just graph set-up
digraph simpsons {
ratio = "auto"
mincross = 2.0

# draw some nodes
"Abraham"   [shape=box, regular=1, color="blue"] ;
"Mona"      [shape=box, regular=1, color="pink"] ;
"Clancy"    [shape=box, regular=1, color="blue"] ;
"Jackeline" [shape=box, regular=1, color="pink"] ;
"Herb"      [shape=box, regular=1, color="blue"] ;
"Homer"     [shape=box, regular=1, color="blue"] ;
"Marge"     [shape=box, regular=1, color="pink"] ;
"Patty"     [shape=box, regular=1, color="pink"] ;
"Selma"     [shape=box, regular=1, color="pink"] ;
"Bart"      [shape=box, regular=1, color="blue"] ;
"Lisa"      [shape=box, regular=1, color="pink"] ;
"Maggie"    [shape=box, regular=1, color="pink"] ;
"Ling"      [shape=box, regular=1, color="blue"] ;
# creating tiny nodes w/ no label, no color
"ParentsHomer" [shape=diamond,style=filled,label="",height=.1,width=.1] ;
"ParentsMarge" [shape=diamond,style=filled,label="",height=.1,width=.1] ;
"ParentsBart"  [shape=diamond,style=filled,label="",height=.1,width=.1] ;

# draw the edges
"Abraham"      -> "ParentsHomer" [dir=none, weight=1] ;
"Mona"         -> "ParentsHomer" [dir=none, weight=1] ;
"ParentsHomer" -> "Homer"        [dir=none, weight=2] ;
"ParentsHomer" -> "Herb"         [dir=none, weight=2] ;
"Clancy"       -> "ParentsMarge" [dir=none, weight=1] ;
"Jackeline"    -> "ParentsMarge" [dir=none, weight=1] ;
"ParentsMarge" -> "Marge"        [dir=none, weight=2] ;
"ParentsMarge" -> "Patty"        [dir=none, weight=2] ;
"ParentsMarge" -> "Selma"        [dir=none, weight=2] ;
"Homer"        -> "ParentsBart"  [dir=none, weight=1] ;
"Marge"        -> "ParentsBart"  [dir=none, weight=1] ;
"ParentsBart"  -> "Bart"         [dir=none, weight=2] ;
"ParentsBart"  -> "Lisa"         [dir=none, weight=2] ;
"ParentsBart"  -> "Maggie"       [dir=none, weight=2] ;
"Selma"        -> "Ling"         [dir=none, weight=2] ;
}
Si je l'exécute par le biais de dot ( dot simpsons.dot -Tsvg > simpsons.svg ),
J'obtiens la disposition suivante:
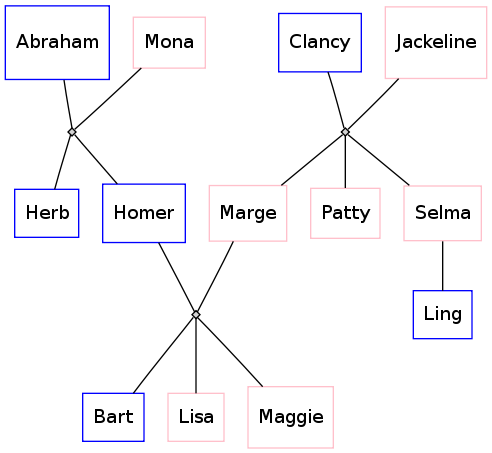
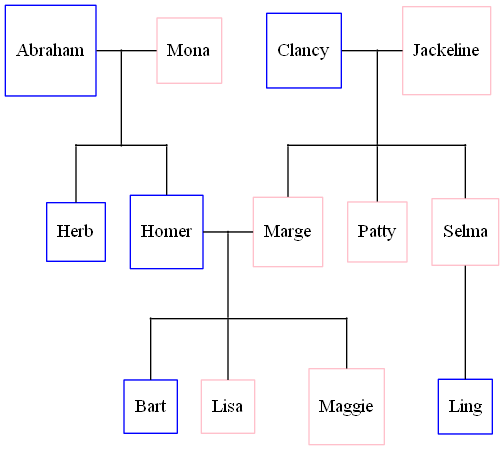
cependant, je voudrais que les bords soient plus "Arbre de la famille"-comme: un t-jonction entre deux personnes mariées avec la ligne verticale du T à nouveau branchement dans un t-jonction à l'envers avec de petites subdivisions pour chacun des enfants, comme cette maquette, faite à KolourPaint:
Quelle est la syntaxe des points que je dois utiliser pour réaliser ceci?
6 réponses
Voici une autre solution:
digraph simpsons {
  subgraph Generation0 {
    rank = same
    Abraham [shape = box, color = blue]
    Mona [shape = box, color = pink]
    AbrahamAndMona [shape = point]
    Abraham -> AbrahamAndMona [dir = none]
    AbrahamAndMona -> Mona [dir = none]

    Clancy [shape = box, color = blue]
    Jackeline [shape = box, color = pink]
    ClancyAndJackeline [shape = point]
    Clancy -> ClancyAndJackeline [dir = none]
    ClancyAndJackeline -> Jackeline [dir = none]
  }

  subgraph Generation0Sons {
    rank = same
    AbrahamAndMonaSons [shape = point]
    HerbSon [shape = point]
    HomerSon [shape = point]
    HerbSon -> AbrahamAndMonaSons [dir = none]
    HomerSon -> AbrahamAndMonaSons [dir = none]

    MargeSon [shape = point]
    PattySon [shape = point]
    SelmaSon [shape = point]
    MargeSon -> PattySon [dir = none]
    PattySon -> SelmaSon [dir = none]
  }

  AbrahamAndMona -> AbrahamAndMonaSons [dir = none]
  ClancyAndJackeline -> PattySon [dir = none]

  subgraph Generation1 {
    rank  =  same
    Herb [shape = box, color = blue]
    Homer [shape = box, color = blue]
    Marge [shape = box, color = pink]
    Patty [shape = box, color = pink]
    Selma [shape = box, color = pink]

    HomerAndMarge [shape = point]
    Homer -> HomerAndMarge [dir = none]
    Marge -> HomerAndMarge [dir = none]
  }

  HerbSon -> Herb [dir = none]
  HomerSon -> Homer [dir = none]
  MargeSon -> Marge [dir = none]
  PattySon -> Patty [dir = none]
  SelmaSon -> Selma [dir = none]

  subgraph Generation1Sons {
    rank  =  same
    BartSon [shape = point]
    LisaSon [shape = point]
    MaggieSon [shape = point]

    BartSon -> LisaSon [dir = none]
    LisaSon -> MaggieSon [dir = none]
  }

  HomerAndMarge -> LisaSon [dir = none]

  subgraph Generation2 {
    rank  =  same
    Bart [shape = box, color = blue]
    Lisa [shape = box, color = pink]
    Maggie [shape = box, color = pink]
    Ling [shape = box, color = blue]
  }

  Selma -> Ling [dir = none]
  BartSon -> Bart [dir = none]
  LisaSon -> Lisa [dir = none]
  MaggieSon -> Maggie [dir = none]
}
et le résultat:
Gramps (www.gramps-project.org) génère des fichiers de points pour les Arbres familiaux, avec ou sans noeuds de mariage. Il y a aussi un moyen de le voir dans L'interface de Gramps elle-même. http://gramps-project.org/wiki/index.php?title=Graph_View Donc je dirais, regardez la sortie de votre arbre généalogique tel que créé par Papy
Je ne pense pas que vous pouvez prendre un arbre généalogique arbitraire et auto-générer un fichier de points où il semble toujours bon dans GraphViz.
mais je pense que vous pouvez toujours faire bonne impression si vous:
- utilisez le rang = mêmes autres réponses mentionnées pour obtenir les' T ' connections souhaité par le PO
- utilisez le truc de commande que Brian Blank a fait pour empêcher les lignes bizarres
- supposons qu'il n'y a pas de seconde mariages et demi-frères et demi-sœurs
- Dessiner un
sous-ensemble de l'arbre qui obéit aux règles suivantes:
- soyons la "personne du centre
- si S a des frères et sœurs, assurez-vous que S est à droite de tous.
- si S a un conjoint et que le conjoint a des frères et sœurs, assurez-vous que le conjoint est à la gauche de tous ses frères et sœurs.
- Ne pas afficher neveux, nièces, tantes ou des oncles de S ou S du conjoint
- ne pas montrer les conjoints de frères et sœurs
- ne pas montrer les conjoints des frères et sœurs du conjoint
- montrer enfants de S, mais pas leurs conjoints ou enfants
- montrer parents de S et parents de conjoint
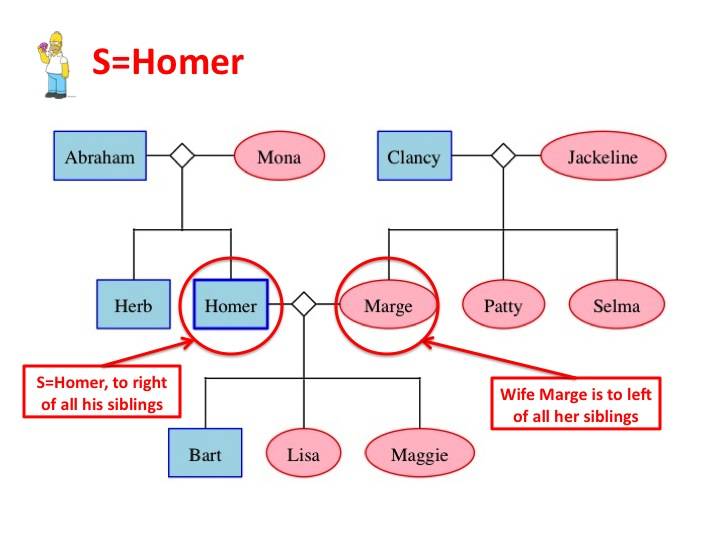
cela finira par Montrer pas plus de 3 générations à la fois, avec S dans la génération moyenne.
dans L'image ci-dessous S=Homer (légèrement modifié de Version de Brian Blank):
digraph G {
  edge [dir=none];
  node [shape=box];

  "Herb"      [shape=box, regular=0, color="blue", style="filled" fillcolor="lightblue"] ;
  "Homer"     [shape=box, regular=0, color="blue", style="bold, filled" fillcolor="lightblue"] ;
  "Marge"     [shape=oval, regular=0, color="red", style="filled" fillcolor="pink"] ;
  "Clancy"    [shape=box, regular=0, color="blue", style="filled" fillcolor="lightblue"] ;
  "Jackeline" [shape=oval, regular=0, color="red", style="filled" fillcolor="pink"] ;
  "Abraham"   [shape=box, regular=0, color="blue", style="filled" fillcolor="lightblue"] ;
  "Mona"      [shape=oval, regular=0, color="red", style="filled" fillcolor="pink"] ;
  "Patty"     [shape=oval, regular=0, color="red", style="filled" fillcolor="pink"] ;
  "Selma"     [shape=oval, regular=0, color="red", style="filled" fillcolor="pink"] ;
  "Bart"      [shape=box, regular=0, color="blue", style="filled" fillcolor="lightblue"] ;
  "Lisa"      [shape=oval, regular=0, color="red", style="filled" fillcolor="pink"] ;
  "Maggie"    [shape=oval, regular=0, color="red", style="filled" fillcolor="pink"] ;

  a1 [shape=diamond,label="",height=0.25,width=0.25];
  b1 [shape=circle,label="",height=0.01,width=0.01];
  b2 [shape=circle,label="",height=0.01,width=0.01];
  b3 [shape=circle,label="",height=0.01,width=0.01];
  {rank=same; Abraham -> a1 -> Mona};
  {rank=same; b1 -> b2 -> b3};
  {rank=same; Herb; Homer};
  a1 -> b2
  b1 -> Herb
  b3 -> Homer

  p1 [shape=diamond,label="",height=0.25,width=0.25];
  q1 [shape=circle,label="",height=0.01,width=0.01];
  q2 [shape=circle,label="",height=0.01,width=0.01];
  q3 [shape=circle,label="",height=0.01,width=0.01];
  {rank=same; Homer -> p1 -> Marge};
  {rank=same; q1 -> q2 -> q3};
  {rank=same; Bart; Lisa; Maggie};
  p1 -> q2;
  q1 -> Bart;
  q2 -> Lisa;
  q3 -> Maggie;

  x1 [shape=diamond,label="",height=0.25,width=0.25];
  y1 [shape=circle,label="",height=0.01,width=0.01];
  y2 [shape=circle,label="",height=0.01,width=0.01];
  y3 [shape=circle,label="",height=0.01,width=0.01];
  {rank=same; Clancy -> x1 -> Jackeline};
  {rank=same; y1 -> y2 -> y3};
  {rank=same; Patty; Selma; Marge};
  x1 -> y2;
  y1 -> Marge;
  y2 -> Patty;
  y3 -> Selma;
}
cela donne L'arbre suivant par GraphViz (avec annotations j'ai ajouté avec le point de puissance):
bien que vous ne pouvez pas contrôler le placement des noeuds, j'ai trouvé que vous pouvez aider le placement des Noeuds en ordonnant les noeuds dans un ordre différent. J'ai re-commandé certains des noeuds comme montré ci-dessous et obtenu un graphique qui n'a produit aucun cross-overs.
le code suivant:
digraph G {
  edge [dir=none];
  node [shape=box];

  "Herb"      [shape=box, regular=1, color="blue"] ;
  "Homer"     [shape=box, regular=1, color="blue"] ;
  "Marge"     [shape=box, regular=1, color="pink"] ;
  "Clancy"    [shape=box, regular=1, color="blue"] ;
  "Jackeline" [shape=box, regular=1, color="pink"] ;
  "Abraham"   [shape=box, regular=1, color="blue"] ;
  "Mona"      [shape=box, regular=1, color="pink"] ;
  "Patty"     [shape=box, regular=1, color="pink"] ;
  "Selma"     [shape=box, regular=1, color="pink"] ;
  "Bart"      [shape=box, regular=1, color="blue"] ;
  "Lisa"      [shape=box, regular=1, color="pink"] ;
  "Maggie"    [shape=box, regular=1, color="pink"] ;
  "Ling"      [shape=box, regular=1, color="blue"] ;

  a1 [shape=circle,label="",height=0.01,width=0.01];
  b1 [shape=circle,label="",height=0.01,width=0.01];
  b2 [shape=circle,label="",height=0.01,width=0.01];
  b3 [shape=circle,label="",height=0.01,width=0.01];
  {rank=same; Abraham -> a1 -> Mona};
  {rank=same; b1 -> b2 -> b3};
  {rank=same; Herb; Homer};
  a1 -> b2
  b1 -> Herb
  b3 -> Homer

  p1 [shape=circle,label="",height=0.01,width=0.01];
  q1 [shape=circle,label="",height=0.01,width=0.01];
  q2 [shape=circle,label="",height=0.01,width=0.01];
  q3 [shape=circle,label="",height=0.01,width=0.01];
  {rank=same; Homer -> p1 -> Marge};
  {rank=same; q1 -> q2 -> q3};
  {rank=same; Bart; Lisa; Maggie};
  p1 -> q2;
  q1 -> Bart;
  q2 -> Lisa;
  q3 -> Maggie;

  x1 [shape=circle,label="",height=0.01,width=0.01];
  y1 [shape=circle,label="",height=0.01,width=0.01];
  y2 [shape=circle,label="",height=0.01,width=0.01];
  y3 [shape=circle,label="",height=0.01,width=0.01];
  {rank=same; Clancy -> x1 -> Jackeline};
  {rank=same; y1 -> y2 -> y3};
  {rank=same; Marge; Patty; Selma};
  {rank=same; Bart; Ling}
  x1 -> y2;
  y1 -> Marge;
  y2 -> Patty;
  y3 -> Selma;
  Selma -> Ling;
}
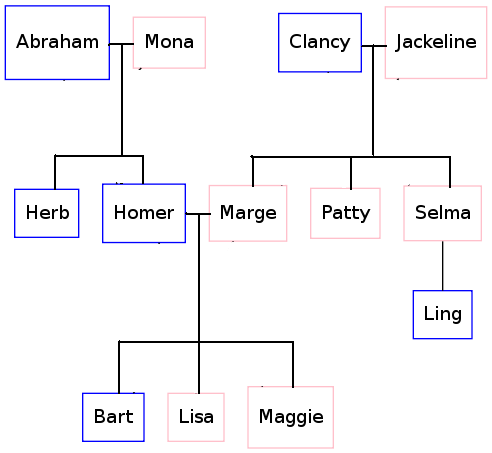
produit maintenant ceci:
Je ne comprends pas tout à fait pourquoi cela fonctionne, mais voici le processus de pensée en les modifications que j'ai faites.
- J'ai placé Clancy/Jackeline devant Abraham/Mona pensant qu'ils étaient du mauvais côté. Cela a changé le tableau, mais n'était toujours pas parfait.
- J'ai placé Homer/Marge d'abord pensant que le logiciel devait considérer ces pièces d'abord et peut-être placer tous les autres noeuds relatifs à Homer/Marge. Cela a aidé davantage, mais n'était toujours pas parfait.
- Herb était encore mal placé, donc j'ai mis Herb en premier de sorte que graphviz pourrait envisager le placement d'herb en premier.
cela a fonctionné, mais je ne peux toujours pas concevoir un algorithme qui assurerait la cohérence des arbres sans bords se chevauchant. Je pense que graphviz devrait faire un meilleur travail sans ces conseils. Je ne connais pas l'algorithme utilisé, mais s'ils considèrent une fonction objective pour minimiser ou éliminer les bords qui se chevauchent, il devrait être possible de concevoir un meilleur algorithme.
pour faire ceci dans graphviz est assez simple; il y a quelques modèles de syntaxe dont vous avez besoin: (I) syntaxe pour représenter la connexion ligne-à-ligne (la jonction "T"dans vos tracés ci-dessus); (ii) syntaxe pour renforcer la structure hiérarchique (i.e., noeuds de même génération sur le même plan sur l'axe vertical). C'est plus facile de montrer:
digraph G {
    nodesep=0.6;
    edge [arrowsize=0.3];

    "g1" -> "g2" -> "g3" -> "g4"

    { rank = same;
        "g1"; "King"; "ph1"; "Queen";
    };

    { rank = same;
        "g2"; "ph2"; "ph2L"; "ph2R"; "ph2LL"; "ph2RR"
    };

    { rank = same;
        "g3"; "ps1"; "ps2"; "pr1"; "pr2"
    };

    "King" -> "ph1" [arrowsize=0.0];
    "ph1" -> "Queen" [arrowsize=0.0];

    "ph1" -> "ph2" [arrowsize=0.0];
    "ph2LL" -> "ph2L" [arrowsize=0.0];
    "ph2L" -> "ph2" [arrowsize=0.0];
    "ph2" -> "ph2R" [arrowsize=0.0];
    "ph2R" -> "ph2RR" [arrowsize=0.0];

    "ph2LL" -> "ps1" [arrowsize=0.0];
    "ph2L"-> "pr1" [arrowsize=0.0];
    "ph2R" -> "ps2" [arrowsize=0.0];
    "ph2RR" -> "pr2" [arrowsize=0.0];

}
Le code ci-dessus va produire le graphique ci-dessous (j'ai omis le code que j'ai utilisé pour colorer les nœuds). J'ai quitté vislble le "guide" à gauche (g1->g2....) juste pour vous montrer comment j'ai appliqué les positions des nœuds de rang égal, vous aurez probablement envie de la rendre invisible dans vos propres graphiques. Enfin, les noeuds avec les étiquettes commençant par 'ph' sont les noeuds placeholder pour les "t-junctions"."
alt texte http://img525.imageshack.us/img525/352/fmtree2.png
j'y suis presque, inspiré par un vieux la réponse sur le graphviz-intérêt mailinglist et doug réponse .
le code suivant:
digraph G {
  edge [dir=none];
  node [shape=box];

  "Abraham"   [shape=box, regular=1, color="blue"] ;
  "Mona"      [shape=box, regular=1, color="pink"] ;
  "Clancy"    [shape=box, regular=1, color="blue"] ;
  "Jackeline" [shape=box, regular=1, color="pink"] ;
  "Herb"      [shape=box, regular=1, color="blue"] ;
  "Homer"     [shape=box, regular=1, color="blue"] ;
  "Marge"     [shape=box, regular=1, color="pink"] ;
  "Patty"     [shape=box, regular=1, color="pink"] ;
  "Selma"     [shape=box, regular=1, color="pink"] ;
  "Bart"      [shape=box, regular=1, color="blue"] ;
  "Lisa"      [shape=box, regular=1, color="pink"] ;
  "Maggie"    [shape=box, regular=1, color="pink"] ;
  "Ling"      [shape=box, regular=1, color="blue"] ;

  a1 [shape=circle,label="",height=0.01,width=0.01];
  b1 [shape=circle,label="",height=0.01,width=0.01];
  b2 [shape=circle,label="",height=0.01,width=0.01];
  b3 [shape=circle,label="",height=0.01,width=0.01];
  {rank=same; Abraham -> a1 -> Mona};
  {rank=same; b1 -> b2 -> b3};
  {rank=same; Herb; Homer};
  a1 -> b2
  b1 -> Herb
  b3 -> Homer

  p1 [shape=circle,label="",height=0.01,width=0.01];
  q1 [shape=circle,label="",height=0.01,width=0.01];
  q2 [shape=circle,label="",height=0.01,width=0.01];
  q3 [shape=circle,label="",height=0.01,width=0.01];
  {rank=same; Homer -> p1 -> Marge};
  {rank=same; q1 -> q2 -> q3};
  {rank=same; Bart; Lisa; Maggie};
  p1 -> q2;
  q1 -> Bart;
  q2 -> Lisa;
  q3 -> Maggie;

  x1 [shape=circle,label="",height=0.01,width=0.01];
  y1 [shape=circle,label="",height=0.01,width=0.01];
  y2 [shape=circle,label="",height=0.01,width=0.01];
  y3 [shape=circle,label="",height=0.01,width=0.01];
  {rank=same; Clancy -> x1 -> Jackeline};
  {rank=same; y1 -> y2 -> y3};
  {rank=same; Marge; Patty; Selma};
  {rank=same; Bart; Ling}
  x1 -> y2;
  y1 -> Marge;
  y2 -> Patty;
  y3 -> Selma;
  Selma -> Ling;
}
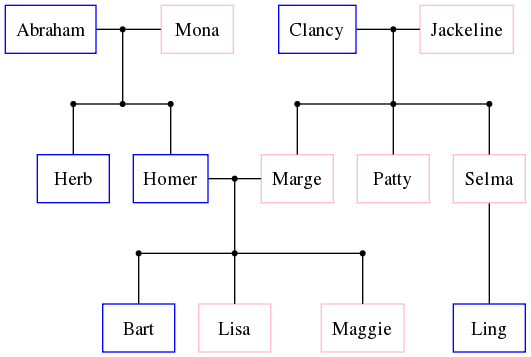
produit maintenant ceci:
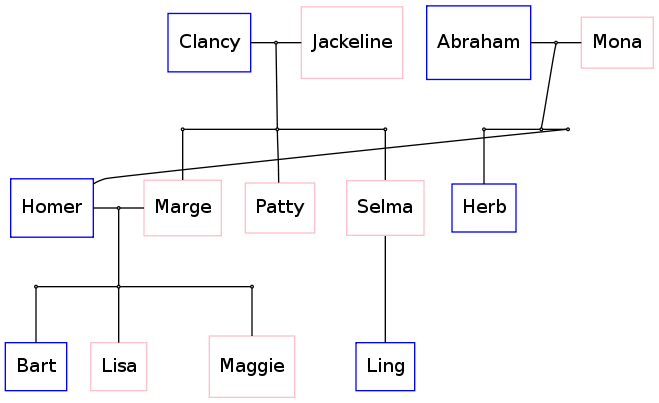
donc, ça a l'air bien sauf pour ce bord étrange autour D'Homer.Si je pouvais trouver un moyen de déplacer Abraham, Mona et Herb du côté gauche de la image alors j'aurais une image parfaitement alignée.
des idées pour y parvenir?