pointage en temps réel en boucle avec matplotlib
j'essaie de tracer quelques données d'une caméra en temps réel en utilisant OpenCV. Cependant, le pointage en temps réel (en utilisant matplotlib) ne semble pas fonctionner.
j'ai isolé le problème dans cet exemple simple:
fig=plt.figure()
plt.axis([0,1000,0,1])

i=0
x=list()
y=list()

while i <1000:
    temp_y=np.random.random()
    x.append(i)
    y.append(temp_y)
    plt.scatter(i,temp_y)
    i+=1
    plt.show()
Je m'attendrais à ce que cet exemple trace 1000 points individuellement. Ce qui se passe réellement est que la fenêtre apparaît avec le premier point d'affichage( ok avec cela), puis attend la boucle pour finir avant qu'il popule reste du graphe.
pourquoi ne vois-je pas des points peuplés un à la fois?
10 réponses
Voici la version de travail du code en question (nécessite au moins la version Matplotlib 1.1.0 de 2011-11-14):
import numpy as np
import matplotlib.pyplot as plt

plt.axis([0, 10, 0, 1])

for i in range(10):
    y = np.random.random()
    plt.scatter(i, y)
    plt.pause(0.05)

plt.show()
noter certains des changements:
- appelez
plt.pause(0.05)pour dessiner les nouvelles données et il exécute la boucle d'événement de L'interface graphique (permettant l'interaction avec la souris).
si vous êtes intéressé par le traçage en temps réel, je vous recommande de consulter l'API d'animation de matplotlib . En particulier, utiliser blit pour éviter de redessiner le fond sur chaque cadre peut vous donner des gains de vitesse substantiels (~10x):
#!/usr/bin/env python

import numpy as np
import time
import matplotlib
matplotlib.use('GTKAgg')
from matplotlib import pyplot as plt


def randomwalk(dims=(256, 256), n=20, sigma=5, alpha=0.95, seed=1):
    """ A simple random walk with memory """

    r, c = dims
    gen = np.random.RandomState(seed)
    pos = gen.rand(2, n) * ((r,), (c,))
    old_delta = gen.randn(2, n) * sigma

    while True:
        delta = (1. - alpha) * gen.randn(2, n) * sigma + alpha * old_delta
        pos += delta
        for ii in xrange(n):
            if not (0. <= pos[0, ii] < r):
                pos[0, ii] = abs(pos[0, ii] % r)
            if not (0. <= pos[1, ii] < c):
                pos[1, ii] = abs(pos[1, ii] % c)
        old_delta = delta
        yield pos


def run(niter=1000, doblit=True):
    """
    Display the simulation using matplotlib, optionally using blit for speed
    """

    fig, ax = plt.subplots(1, 1)
    ax.set_aspect('equal')
    ax.set_xlim(0, 255)
    ax.set_ylim(0, 255)
    ax.hold(True)
    rw = randomwalk()
    x, y = rw.next()

    plt.show(False)
    plt.draw()

    if doblit:
        # cache the background
        background = fig.canvas.copy_from_bbox(ax.bbox)

    points = ax.plot(x, y, 'o')[0]
    tic = time.time()

    for ii in xrange(niter):

        # update the xy data
        x, y = rw.next()
        points.set_data(x, y)

        if doblit:
            # restore background
            fig.canvas.restore_region(background)

            # redraw just the points
            ax.draw_artist(points)

            # fill in the axes rectangle
            fig.canvas.blit(ax.bbox)

        else:
            # redraw everything
            fig.canvas.draw()

    plt.close(fig)
    print "Blit = %s, average FPS: %.2f" % (
        str(doblit), niter / (time.time() - tic))

if __name__ == '__main__':
    run(doblit=False)
    run(doblit=True)
sortie:
Blit = False, average FPS: 54.37
Blit = True, average FPS: 438.27
show n'est probablement pas le meilleur choix pour ce. Ce que je ferais, c'est utiliser pyplot.draw() à la place. Vous pourriez également vouloir inclure un petit délai (par exemple, time.sleep(0.05) ) dans la boucle afin que vous puissiez voir les parcelles se produire. Si j'apporte ces modifications à votre exemple, cela fonctionne pour moi et je vois chaque point apparaître un à la fois.
aucune des méthodes n'a fonctionné pour moi. Mais j'ai trouvé que c' temps Réel matplotlib intrigue n'est pas de travail tout en restant dans une boucle
il suffit D'ajouter
plt.pause(0.0001)
et que vous pouviez voir la nouvelle parcelle.
donc votre code devrait ressembler à ceci, et il fonctionnera
import matplotlib.pyplot as plt
import numpy as np
plt.ion() ## Note this correction
fig=plt.figure()
plt.axis([0,1000,0,1])

i=0
x=list()
y=list()

while i <1000:
    temp_y=np.random.random();
    x.append(i);
    y.append(temp_y);
    plt.scatter(i,temp_y);
    i+=1;
    plt.show()
    plt.pause(0.0001) #Note this correction
je sais que je suis un peu en retard pour répondre à cette question. Néanmoins, j'ai fait un peu de code il y a un certain temps pour tracer des graphiques en direct, que je voudrais partager:
###################################################################
#                                                                 #
#                     PLOTTING A LIVE GRAPH                       #
#                  ----------------------------                   #
#            EMBED A MATPLOTLIB ANIMATION INSIDE YOUR             #
#            OWN GUI!                                             #
#                                                                 #
###################################################################


import sys
import os
from PyQt4 import QtGui
from PyQt4 import QtCore
import functools
import numpy as np
import random as rd
import matplotlib
matplotlib.use("Qt4Agg")
from matplotlib.figure import Figure
from matplotlib.animation import TimedAnimation
from matplotlib.lines import Line2D
from matplotlib.backends.backend_qt4agg import FigureCanvasQTAgg as FigureCanvas
import time
import threading


def setCustomSize(x, width, height):
    sizePolicy = QtGui.QSizePolicy(QtGui.QSizePolicy.Fixed, QtGui.QSizePolicy.Fixed)
    sizePolicy.setHorizontalStretch(0)
    sizePolicy.setVerticalStretch(0)
    sizePolicy.setHeightForWidth(x.sizePolicy().hasHeightForWidth())
    x.setSizePolicy(sizePolicy)
    x.setMinimumSize(QtCore.QSize(width, height))
    x.setMaximumSize(QtCore.QSize(width, height))

''''''

class CustomMainWindow(QtGui.QMainWindow):

    def __init__(self):

        super(CustomMainWindow, self).__init__()

        # Define the geometry of the main window
        self.setGeometry(300, 300, 800, 400)
        self.setWindowTitle("my first window")

        # Create FRAME_A
        self.FRAME_A = QtGui.QFrame(self)
        self.FRAME_A.setStyleSheet("QWidget { background-color: %s }" % QtGui.QColor(210,210,235,255).name())
        self.LAYOUT_A = QtGui.QGridLayout()
        self.FRAME_A.setLayout(self.LAYOUT_A)
        self.setCentralWidget(self.FRAME_A)

        # Place the zoom button
        self.zoomBtn = QtGui.QPushButton(text = 'zoom')
        setCustomSize(self.zoomBtn, 100, 50)
        self.zoomBtn.clicked.connect(self.zoomBtnAction)
        self.LAYOUT_A.addWidget(self.zoomBtn, *(0,0))

        # Place the matplotlib figure
        self.myFig = CustomFigCanvas()
        self.LAYOUT_A.addWidget(self.myFig, *(0,1))

        # Add the callbackfunc to ..
        myDataLoop = threading.Thread(name = 'myDataLoop', target = dataSendLoop, daemon = True, args = (self.addData_callbackFunc,))
        myDataLoop.start()

        self.show()

    ''''''


    def zoomBtnAction(self):
        print("zoom in")
        self.myFig.zoomIn(5)

    ''''''

    def addData_callbackFunc(self, value):
        # print("Add data: " + str(value))
        self.myFig.addData(value)


''' End Class '''


class CustomFigCanvas(FigureCanvas, TimedAnimation):

    def __init__(self):

        self.addedData = []
        print(matplotlib.__version__)

        # The data
        self.xlim = 200
        self.n = np.linspace(0, self.xlim - 1, self.xlim)
        a = []
        b = []
        a.append(2.0)
        a.append(4.0)
        a.append(2.0)
        b.append(4.0)
        b.append(3.0)
        b.append(4.0)
        self.y = (self.n * 0.0) + 50

        # The window
        self.fig = Figure(figsize=(5,5), dpi=100)
        self.ax1 = self.fig.add_subplot(111)


        # self.ax1 settings
        self.ax1.set_xlabel('time')
        self.ax1.set_ylabel('raw data')
        self.line1 = Line2D([], [], color='blue')
        self.line1_tail = Line2D([], [], color='red', linewidth=2)
        self.line1_head = Line2D([], [], color='red', marker='o', markeredgecolor='r')
        self.ax1.add_line(self.line1)
        self.ax1.add_line(self.line1_tail)
        self.ax1.add_line(self.line1_head)
        self.ax1.set_xlim(0, self.xlim - 1)
        self.ax1.set_ylim(0, 100)


        FigureCanvas.__init__(self, self.fig)
        TimedAnimation.__init__(self, self.fig, interval = 50, blit = True)

    def new_frame_seq(self):
        return iter(range(self.n.size))

    def _init_draw(self):
        lines = [self.line1, self.line1_tail, self.line1_head]
        for l in lines:
            l.set_data([], [])

    def addData(self, value):
        self.addedData.append(value)

    def zoomIn(self, value):
        bottom = self.ax1.get_ylim()[0]
        top = self.ax1.get_ylim()[1]
        bottom += value
        top -= value
        self.ax1.set_ylim(bottom,top)
        self.draw()


    def _step(self, *args):
        # Extends the _step() method for the TimedAnimation class.
        try:
            TimedAnimation._step(self, *args)
        except Exception as e:
            self.abc += 1
            print(str(self.abc))
            TimedAnimation._stop(self)
            pass

    def _draw_frame(self, framedata):
        margin = 2
        while(len(self.addedData) > 0):
            self.y = np.roll(self.y, -1)
            self.y[-1] = self.addedData[0]
            del(self.addedData[0])


        self.line1.set_data(self.n[ 0 : self.n.size - margin ], self.y[ 0 : self.n.size - margin ])
        self.line1_tail.set_data(np.append(self.n[-10:-1 - margin], self.n[-1 - margin]), np.append(self.y[-10:-1 - margin], self.y[-1 - margin]))
        self.line1_head.set_data(self.n[-1 - margin], self.y[-1 - margin])
        self._drawn_artists = [self.line1, self.line1_tail, self.line1_head]


''' End Class '''


# You need to setup a signal slot mechanism, to
# send data to your GUI in a thread-safe way.
# Believe me, if you don't do this right, things
# go very very wrong..
class Communicate(QtCore.QObject):
    data_signal = QtCore.pyqtSignal(float)

''' End Class '''


def dataSendLoop(addData_callbackFunc):
    # Setup the signal-slot mechanism.
    mySrc = Communicate()
    mySrc.data_signal.connect(addData_callbackFunc)

    # Simulate some data
    n = np.linspace(0, 499, 500)
    y = 50 + 25*(np.sin(n / 8.3)) + 10*(np.sin(n / 7.5)) - 5*(np.sin(n / 1.5))
    i = 0

    while(True):
        if(i > 499):
            i = 0
        time.sleep(0.1)
        mySrc.data_signal.emit(y[i]) # <- Here you emit a signal!
        i += 1
    ###
###


if __name__== '__main__':
    app = QtGui.QApplication(sys.argv)
    QtGui.QApplication.setStyle(QtGui.QStyleFactory.create('Plastique'))
    myGUI = CustomMainWindow()


    sys.exit(app.exec_())

''''''
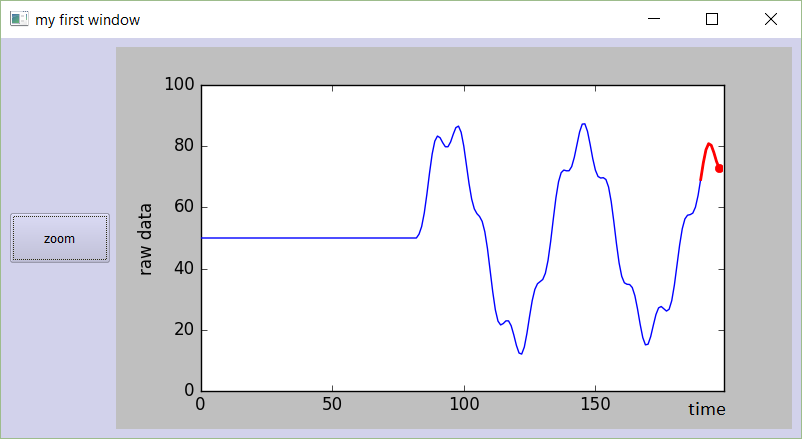
essayez. Copiez-collez ce code dans un nouveau fichier python et lancez-le. Vous devriez obtenir un graphique beau, se déplaçant en douceur:
je sais que cette question Est ancienne, mais il y a maintenant un paquet disponible appelé drawnow sur GitHub comme"python-drawnow". Cela fournit une interface similaire à drawnow de MATLAB -- vous pouvez facilement mettre à jour une figure.
Un exemple pour votre cas d'utilisation:
import matplotlib.pyplot as plt
from drawnow import drawnow

def make_fig():
    plt.scatter(x, y)  # I think you meant this

plt.ion()  # enable interactivity
fig = plt.figure()  # make a figure

x = list()
y = list()

for i in range(1000):
    temp_y = np.random.random()
    x.append(i)
    y.append(temp_y)  # or any arbitrary update to your figure's data
    i += 1
    drawnow(make_fig)
python-drawnow est un wrapper fin autour de plt.draw mais fournit la possibilité de confirmer (ou déboguer) après l'affichage de la figure.
Le problème semble être que vous attendez plt.show() pour afficher la fenêtre, puis de revenir. Il ne le fait pas. Le programme s'arrêtera à ce point et ne reprendra que lorsque vous fermez la fenêtre. Vous devriez être en mesure de tester: Si vous fermez la fenêtre, puis une autre fenêtre devrait apparaître.
pour résoudre ce problème, il suffit d'appeler plt.show() une fois après votre boucle. Ensuite, vous obtenez l'intrigue complète. (Mais pas un "tracé en temps réel')
You peut essayer de définir le mot-clé-argument block comme ceci: plt.show(block=False) une fois au début et puis utiliser .draw() pour mettre à jour.
Voici une version que je dois travailler sur mon système.
import matplotlib.pyplot as plt
from drawnow import drawnow
import numpy as np

def makeFig():
    plt.scatter(xList,yList) # I think you meant this

plt.ion() # enable interactivity
fig=plt.figure() # make a figure

xList=list()
yList=list()

for i in np.arange(50):
    y=np.random.random()
    xList.append(i)
    yList.append(y)
    drawnow(makeFig)
    #makeFig()      The drawnow(makeFig) command can be replaced
    #plt.draw()     with makeFig(); plt.draw()
    plt.pause(0.001)
la ligne drawnow(makeFig) peut être remplacée par une makeFig(); plt.draw() de la séquence et il fonctionne toujours OK.
les réponses du haut (et beaucoup d'autres) ont été construites sur plt.pause() , mais c'était une ancienne façon d'animer le terrain à matplotlib. Il n'est pas seulement lent, mais il fait aussi que le focus est saisi à chaque mise à jour (j'ai eu du mal à arrêter le processus de complot python).
TL;DR: vous pouvez utiliser matplotlib.animation ( , comme mentionné dans la documentation ).
Après avoir creusé autour de diverses réponses et morceaux de code, cela s'est en fait avéré être une façon douce de dessiner des données entrantes infiniment pour moi.
Voici mon code pour un démarrage rapide. Il trace le temps courant avec un nombre aléatoire dans [0, 100) tous les 200ms à l'infini, tout en manipulant le réajustement automatique de la vue:
from datetime import datetime
from matplotlib import pyplot
from matplotlib.animation import FuncAnimation
from random import randrange

x_data, y_data = [], []

figure = pyplot.figure()
line, = pyplot.plot_date(x_data, y_data, '-')

def update(frame):
    x_data.append(datetime.now())
    y_data.append(randrange(0, 100))
    line.set_data(x_data, y_data)
    figure.gca().relim()
    figure.gca().autoscale_view()
    return line,

animation = FuncAnimation(figure, update, interval=200)

pyplot.show()
vous pouvez également explorer blit pour une meilleure performance comme dans la Documentation de Foncanimation .
si vous voulez dessiner et ne pas congeler votre fil comme plus de point sont dessinés, vous devez utiliser plt.pause() pas de temps.sleep ()
im utilisant le code suivant pour tracer une série de coordonnées xy.
import matplotlib.pyplot as plt
import math


pi = 3.14159

fig, ax = plt.subplots()

x = []
y = []

def PointsInCircum(r,n=20):
    circle = [(math.cos(2*pi/n*x)*r,math.sin(2*pi/n*x)*r) for x in xrange(0,n+1)]
    return circle

circle_list = PointsInCircum(3, 50)

for t in range(len(circle_list)):
    if t == 0:
        points, = ax.plot(x, y, marker='o', linestyle='--')
        ax.set_xlim(-4, 4)
        ax.set_ylim(-4, 4)
    else:
        x_coord, y_coord = circle_list.pop()
        x.append(x_coord)
        y.append(y_coord)
        points.set_data(x, y)
    plt.pause(0.01)