Tracer un plan basé sur un vecteur normal et un point dans Matlab ou matplotlib
comment tracer un avion dans matlab ou matplotlib à partir d'un vecteur normal et d'un point?
5 réponses
Pour Matlab:
point = [1,2,3];
normal = [1,1,2];
%# a plane is a*x+b*y+c*z+d=0
%# [a,b,c] is the normal. Thus, we have to calculate
%# d and we're set
d = -point*normal'; %'# dot product for less typing
%# create x,y
[xx,yy]=ndgrid(1:10,1:10);
%# calculate corresponding z
z = (-normal(1)*xx - normal(2)*yy - d)/normal(3);
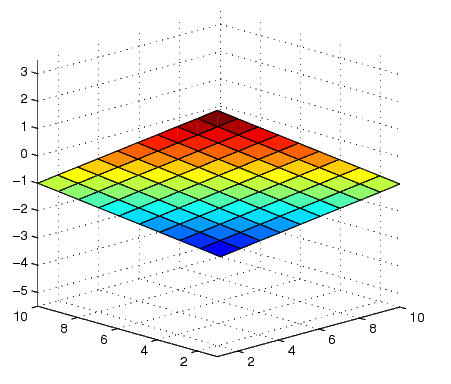
%# plot the surface
figure
surf(xx,yy,z)
Note: Cette solution ne fonctionne que tant que normal(3) n'est pas 0. Si le plan est parallèle à l'axe z, Vous pouvez tourner les dimensions pour garder la même approche:
z = (-normal(3)*xx - normal(1)*yy - d)/normal(2); %% assuming normal(3)==0 and normal(2)~=0

%% plot the surface
figure
surf(xx,yy,z)

%% label the axis to avoid confusion
xlabel('z')
ylabel('x')
zlabel('y')
Pour tous les copier/dérouleurs, voici un code similaire pour Python à l'aide de matplotlib:
import numpy as np
import matplotlib.pyplot as plt
from mpl_toolkits.mplot3d import Axes3D
point = np.array([1, 2, 3])
normal = np.array([1, 1, 2])
# a plane is a*x+b*y+c*z+d=0
# [a,b,c] is the normal. Thus, we have to calculate
# d and we're set
d = -point.dot(normal)
# create x,y
xx, yy = np.meshgrid(range(10), range(10))
# calculate corresponding z
z = (-normal[0] * xx - normal[1] * yy - d) * 1. /normal[2]
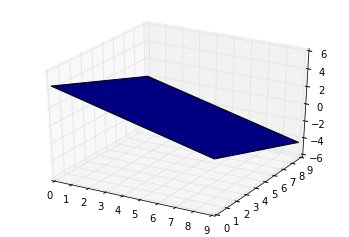
# plot the surface
plt3d = plt.figure().gca(projection='3d')
plt3d.plot_surface(xx, yy, z)
plt.show()
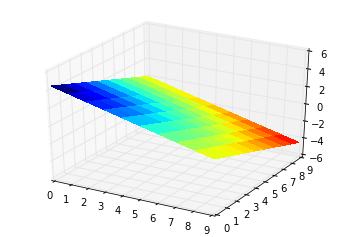
Pour copier-dérouleurs de vouloir un dégradé sur la surface:
from mpl_toolkits.mplot3d import Axes3D
from matplotlib import cm
import numpy as np
import matplotlib.pyplot as plt

point = np.array([1, 2, 3])
normal = np.array([1, 1, 2])

# a plane is a*x+b*y+c*z+d=0
# [a,b,c] is the normal. Thus, we have to calculate
# d and we're set
d = -point.dot(normal)

# create x,y
xx, yy = np.meshgrid(range(10), range(10))

# calculate corresponding z
z = (-normal[0] * xx - normal[1] * yy - d) * 1. / normal[2]

# plot the surface
plt3d = plt.figure().gca(projection='3d')

Gx, Gy = np.gradient(xx * yy)  # gradients with respect to x and y
G = (Gx ** 2 + Gy ** 2) ** .5  # gradient magnitude
N = G / G.max()  # normalize 0..1

plt3d.plot_surface(xx, yy, z, rstride=1, cstride=1,
                   facecolors=cm.jet(N),
                   linewidth=0, antialiased=False, shade=False
)
plt.show()
Les réponses ci-dessus sont assez bonnes. Une chose à mentionner est qu'ils utilisent la même méthode qui calcule la valeur de z Pour donnée (x,y). Le retrait vient qu'ils meshgrid le plan et le plan dans l'espace peut varier (seulement en gardant sa projection la même). Par exemple, vous ne pouvez pas obtenir un carré dans L'espace 3D (mais un Déformé).
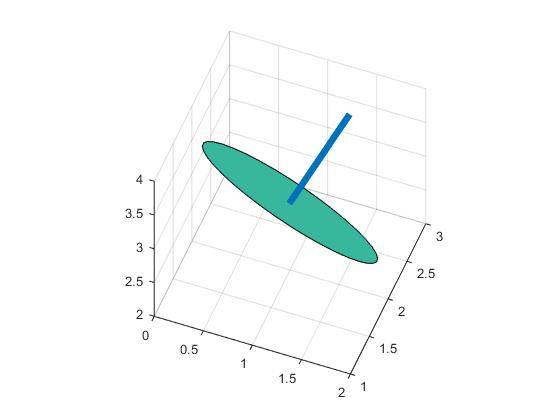
pour éviter cela, il y a une autre façon d'utiliser la rotation. Si vous générez d'abord des données dans le plan x-y (peut être n'importe quelle forme), puis le tourner par quantité égale ([0 0 1] à votre vecteur) , alors vous obtiendrez ce que vous voulez. Simplement exécuter le code ci-dessous pour votre référence.
point = [1,2,3];
normal = [1,2,2];
t=(0:10:360)';
circle0=[cosd(t) sind(t) zeros(length(t),1)];
r=vrrotvec2mat(vrrotvec([0 0 1],normal));
circle=circle0*r'+repmat(point,length(circle0),1);
patch(circle(:,1),circle(:,2),circle(:,3),.5);
axis square; grid on;
%add line
line=[point;point+normr(normal)]
hold on;plot3(line(:,1),line(:,2),line(:,3),'LineWidth',5)
Il obtenir un cercle en 3D:
un exemple de Python propre qui fonctionne aussi pour les $Z,y,z$ situations délicates,
from mpl_toolkits.mplot3d import axes3d
from matplotlib.patches import Circle, PathPatch
import matplotlib.pyplot as plt
from matplotlib.transforms import Affine2D
from mpl_toolkits.mplot3d import art3d
import numpy as np
def plot_vector(fig, orig, v, color='blue'):
ax = fig.gca(projection='3d')
orig = np.array(orig); v=np.array(v)
ax.quiver(orig[0], orig[1], orig[2], v[0], v[1], v[2],color=color)
ax.set_xlim(0,10);ax.set_ylim(0,10);ax.set_zlim(0,10)
ax = fig.gca(projection='3d')
return fig
def rotation_matrix(d):
sin_angle = np.linalg.norm(d)
if sin_angle == 0:return np.identity(3)
d /= sin_angle
eye = np.eye(3)
ddt = np.outer(d, d)
skew = np.array([[ 0, d[2], -d[1]],
[-d[2], 0, d[0]],
[d[1], -d[0], 0]], dtype=np.float64)
M = ddt + np.sqrt(1 - sin_angle**2) * (eye - ddt) + sin_angle * skew
return M
def pathpatch_2d_to_3d(pathpatch, z, normal):
if type(normal) is str: #Translate strings to normal vectors
index = "xyz".index(normal)
normal = np.roll((1.0,0,0), index)
normal /= np.linalg.norm(normal) #Make sure the vector is normalised
path = pathpatch.get_path() #Get the path and the associated transform
trans = pathpatch.get_patch_transform()
path = trans.transform_path(path) #Apply the transform
pathpatch.__class__ = art3d.PathPatch3D #Change the class
pathpatch._code3d = path.codes #Copy the codes
pathpatch._facecolor3d = pathpatch.get_facecolor #Get the face color
verts = path.vertices #Get the vertices in 2D
d = np.cross(normal, (0, 0, 1)) #Obtain the rotation vector
M = rotation_matrix(d) #Get the rotation matrix
pathpatch._segment3d = np.array([np.dot(M, (x, y, 0)) + (0, 0, z) for x, y in verts])
def pathpatch_translate(pathpatch, delta):
pathpatch._segment3d += delta
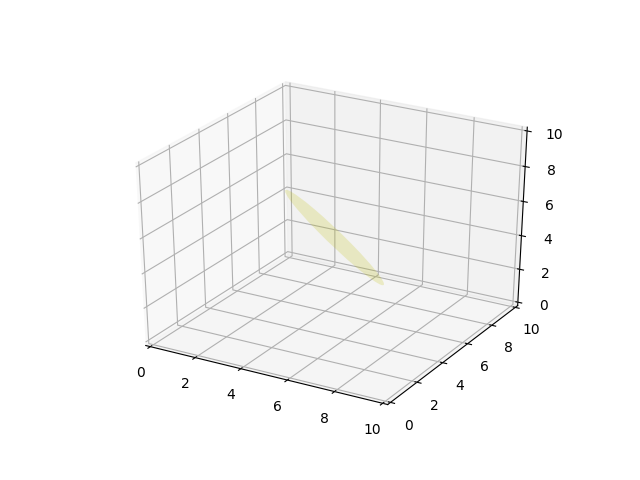
def plot_plane(ax, point, normal, size=10, color='y'):
p = Circle((0, 0), size, facecolor = color, alpha = .2)
ax.add_patch(p)
pathpatch_2d_to_3d(p, z=0, normal=normal)
pathpatch_translate(p, (point[0], point[1], point[2]))
o = np.array([5,5,5])
v = np.array([3,3,3])
n = [0.5, 0.5, 0.5]
from mpl_toolkits.mplot3d import Axes3D
fig = plt.figure()
ax = fig.gca(projection='3d')
plot_plane(ax, o, n, size=3)
ax.set_xlim(0,10);ax.set_ylim(0,10);ax.set_zlim(0,10)
plt.show()