Tracer 4 courbes dans un seul tracé avec 3 axes y
J'ai 4 ensembles de valeurs: y1, y2, y3, y4 et un ensemble X. Les valeurs y sont de différentes plages, et j'ai besoin de les tracer comme des courbes séparées avec des ensembles séparés de valeurs sur l'axe des Y.
Pour simplifier, j'ai besoin de 3 axes y avec des valeurs différentes (échelles) pour tracer sur la même figure.
3 réponses
Essayez ceci....
# The data have a common independent variable (x)
x <- 1:10
# Generate 4 different sets of outputs
y1 <- runif(10, 0, 1)
y2 <- runif(10, 100, 150)
y3 <- runif(10, 1000, 2000)
y4 <- runif(10, 40000, 50000)
y <- list(y1, y2, y3, y4)
# Colors for y[[2]], y[[3]], y[[4]] points and axes
colors = c("red", "blue", "green")
# Set the margins of the plot wider
par(oma = c(0, 2, 2, 3))
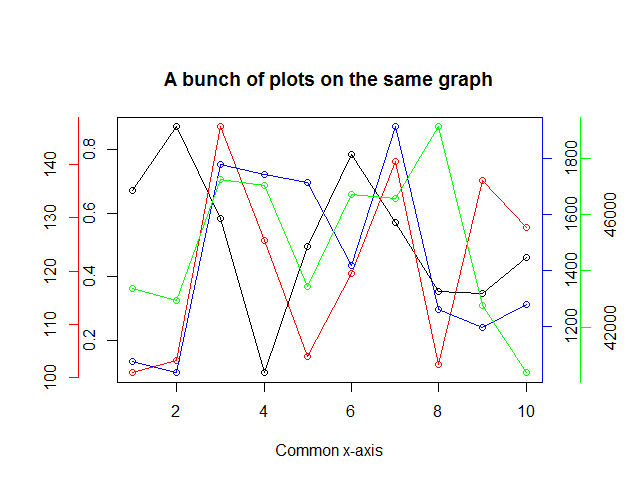
plot(x, y[[1]], yaxt = "n", xlab = "Common x-axis", main = "A bunch of plots on the same graph",
ylab = "")
lines(x, y[[1]])
# We use the "pretty" function go generate nice axes
axis(at = pretty(y[[1]]), side = 2)
# The side for the axes. The next one will go on
# the left, the following two on the right side
sides <- list(2, 4, 4)
# The number of "lines" into the margin the axes will be
lines <- list(2, NA, 2)
for(i in 2:4) {
par(new = TRUE)
plot(x, y[[i]], axes = FALSE, col = colors[i - 1], xlab = "", ylab = "")
axis(at = pretty(y[[i]]), side = sides[[i-1]], line = lines[[i-1]],
col = colors[i - 1])
lines(x, y[[i]], col = colors[i - 1])
}
# Profit.
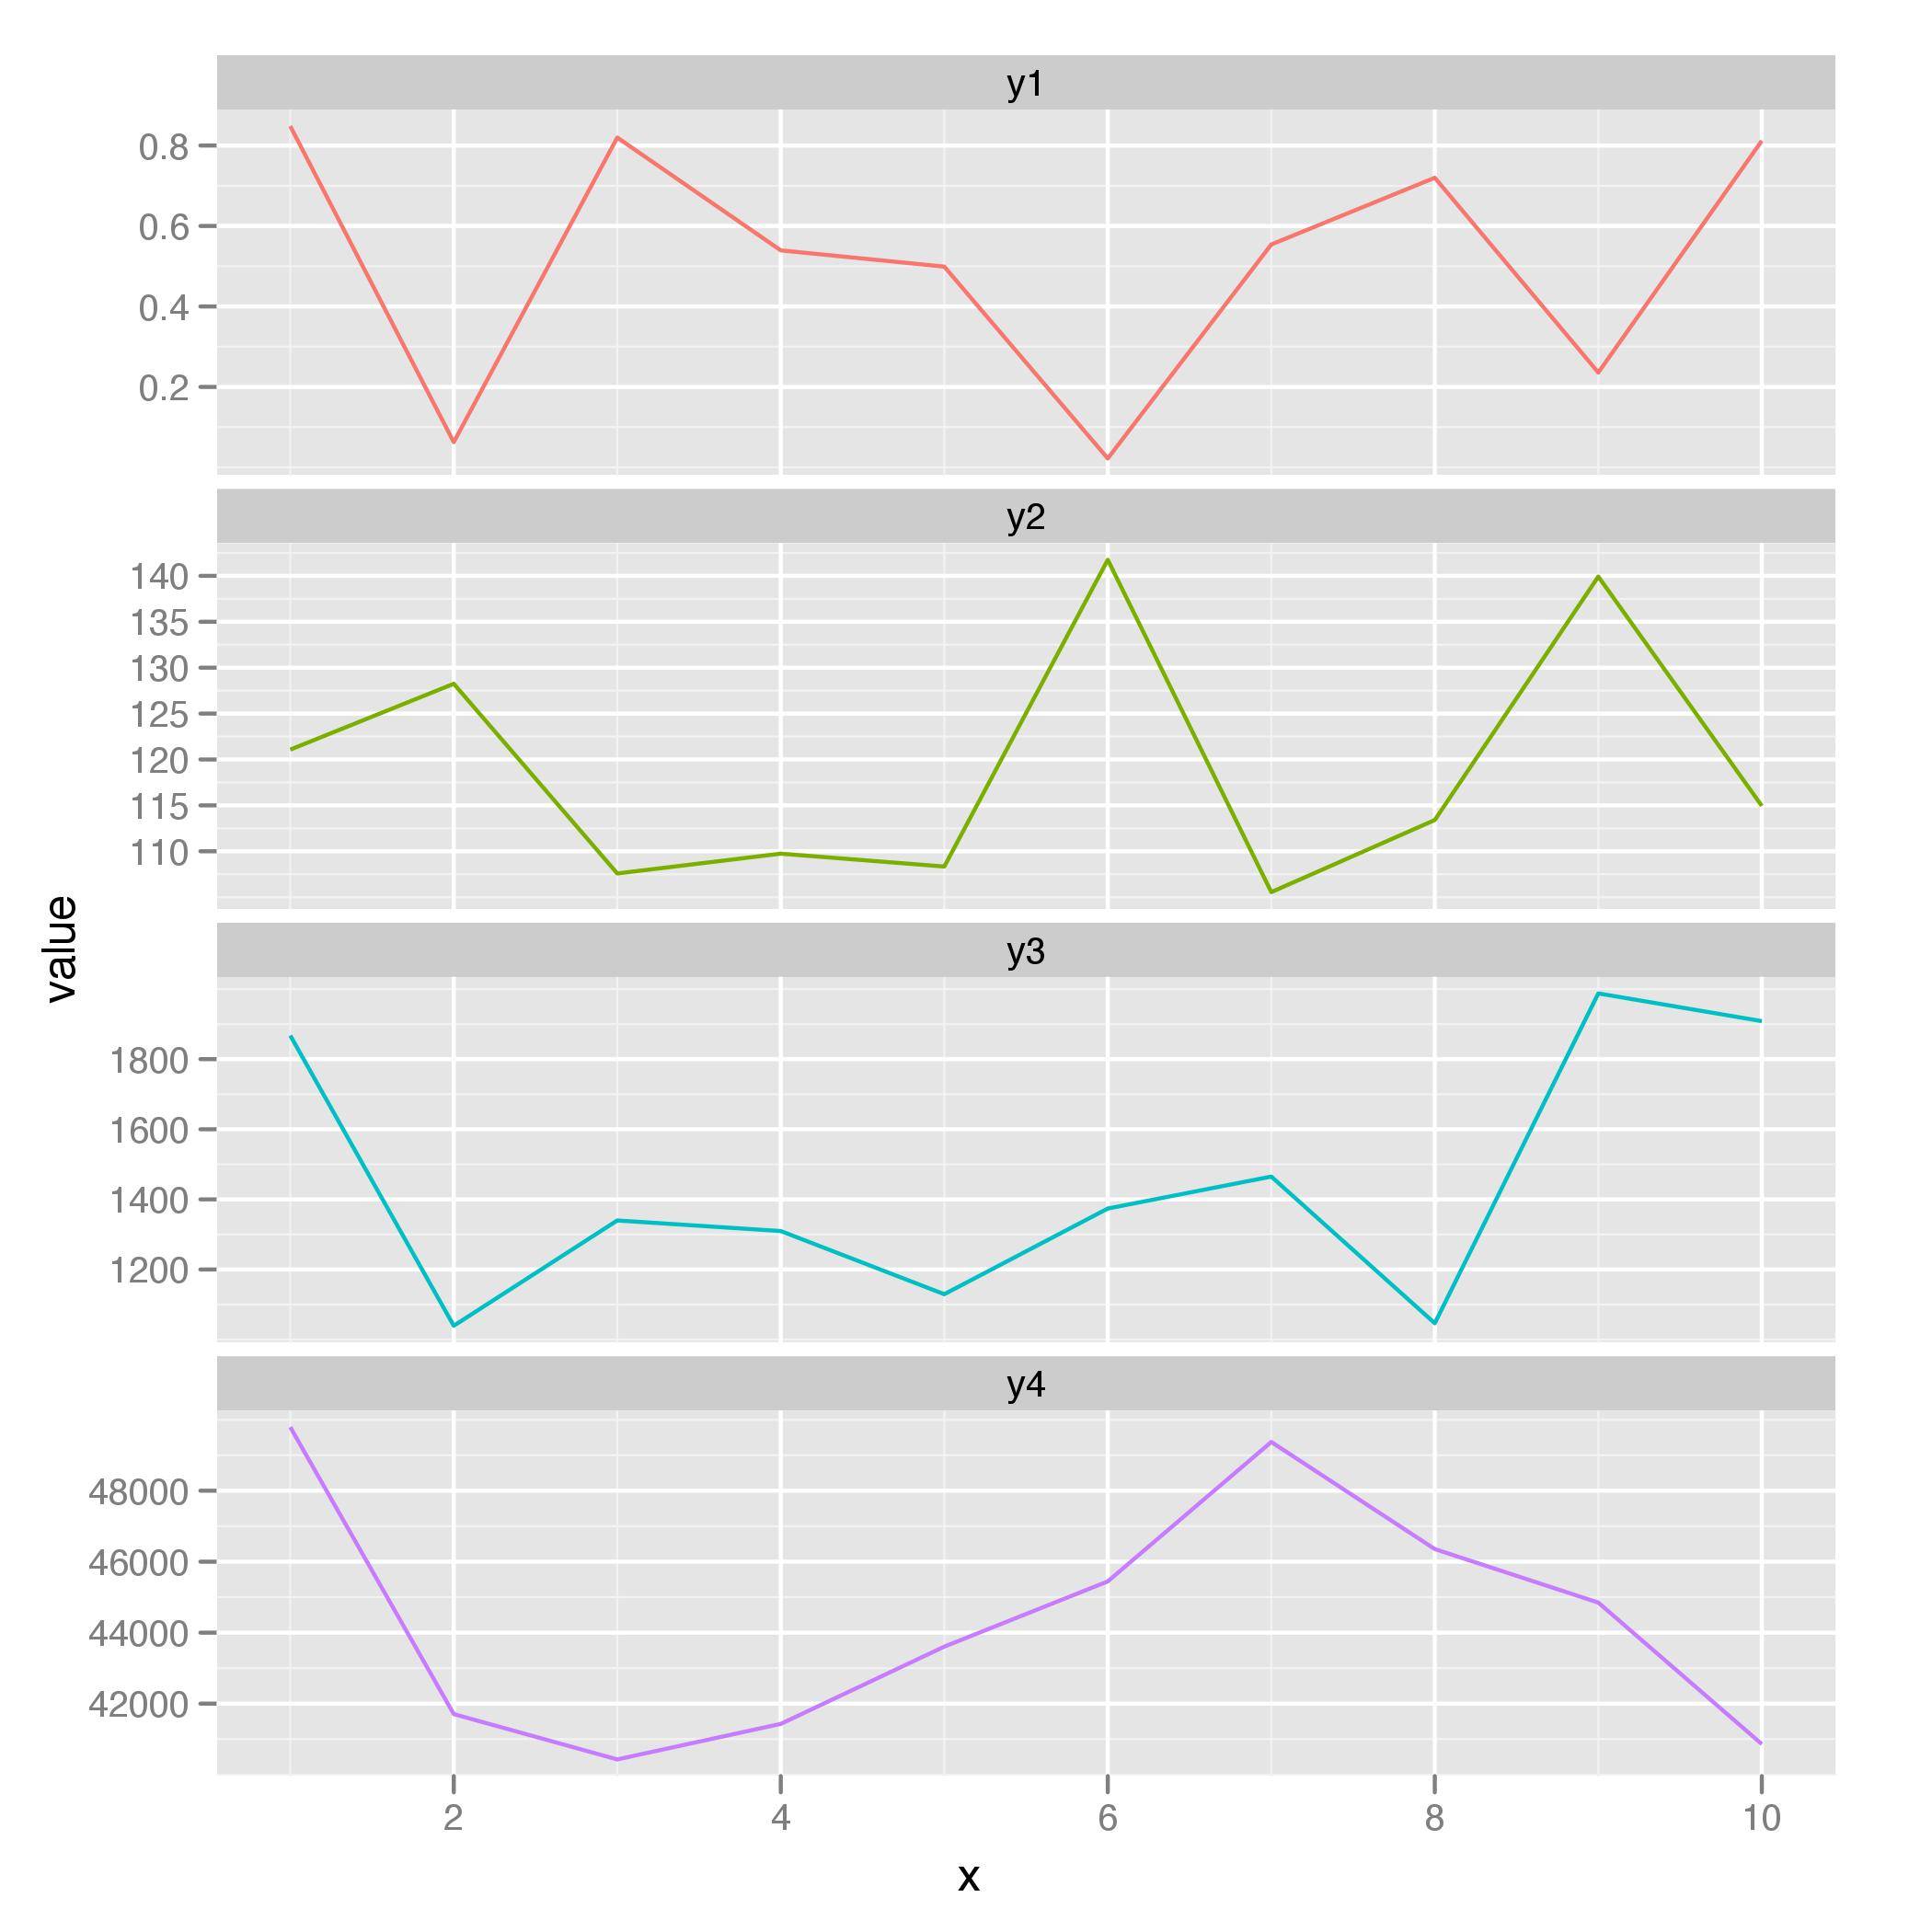
Si vous voulez aller sur le chemin de l'apprentissage d'un paquet de traçage au-delà des graphiques de base, voici une solution avec ggplot2 en utilisant les variables de la réponse de @Rguy:
library(ggplot2)
dat <- data.frame(x, y1, y2, y3, y4)

dat.m <- melt(dat, "x")

ggplot(dat.m, aes(x, value, colour = variable)) + geom_line() +
facet_wrap(~ variable, ncol = 1, scales = "free_y") +
scale_colour_discrete(legend = FALSE)
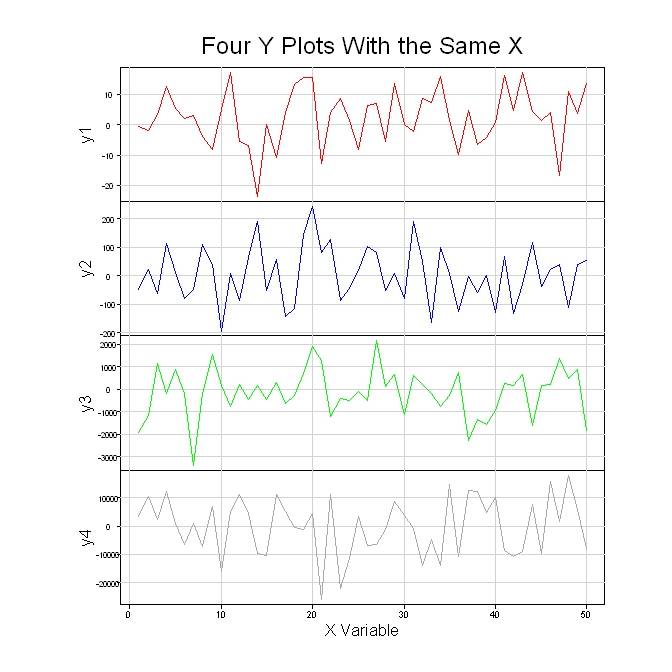
Essayez ce qui suit. Il n'est pas aussi compliqué qu'il y paraît. Une fois que vous regardez le premier graphique en cours de construction, vous verrez que les autres sont très similaires. Et, comme il existe quatre graphiques similaires, vous pouvez facilement reconfigurer le code en une fonction qui est utilisée encore et encore pour dessiner chaque graphique. Cependant, comme je dessine généralement toutes sortes de graphiques avec le même axe x, j'ai besoin de beaucoup de flexibilité. Donc, j'ai décidé qu'il est plus facile de simplement copier/coller/modifier le code pour chaque graphique.
#Generate the data for the four graphs
x <- seq(1, 50, 1)
y1 <- 10*rnorm(50)
y2 <- 100*rnorm(50)
y3 <- 1000*rnorm(50)
y4 <- 10000*rnorm(50)

#Set up the plot area so that multiple graphs can be crammed together
par(pty="m", plt=c(0.1, 1, 0, 1), omd=c(0.1,0.9,0.1,0.9))

#Set the area up for 4 plots
par(mfrow = c(4, 1))

#Plot the top graph with nothing in it =========================
plot(x, y1, xlim=range(x), type="n", xaxt="n", yaxt="n", main="", xlab="", ylab="")
mtext("Four Y Plots With the Same X", 3, line=1, cex=1.5)

#Store the x-axis data of the top plot so it can be used on the other graphs
pardat<-par()
xaxisdat<-seq(pardat$xaxp[1],pardat$xaxp[2],(pardat$xaxp[2]-pardat$xaxp[1])/pardat$xaxp[3])

#Get the y-axis data and add the lines and label
yaxisdat<-seq(pardat$yaxp[1],pardat$yaxp[2],(pardat$yaxp[2]-pardat$yaxp[1])/pardat$yaxp[3])
axis(2, at=yaxisdat, las=2, padj=0.5, cex.axis=0.8, hadj=0.5, tcl=-0.3)
abline(v=xaxisdat, col="lightgray")
abline(h=yaxisdat, col="lightgray")
mtext("y1", 2, line=2.3)
lines(x, y1, col="red")

#Plot the 2nd graph with nothing ================================
plot(x, y2, xlim=range(x), type="n", xaxt="n", yaxt="n", main="", xlab="", ylab="")

#Get the y-axis data and add the lines and label
pardat<-par()
yaxisdat<-seq(pardat$yaxp[1],pardat$yaxp[2],(pardat$yaxp[2]-pardat$yaxp[1])/pardat$yaxp[3])
axis(2, at=yaxisdat, las=2, padj=0.5, cex.axis=0.8, hadj=0.5, tcl=-0.3)
abline(v=xaxisdat, col="lightgray")
abline(h=yaxisdat, col="lightgray")
mtext("y2", 2, line=2.3)
lines(x, y2, col="blue")

#Plot the 3rd graph with nothing =================================
plot(x, y3, xlim=range(x), type="n", xaxt="n", yaxt="n", main="", xlab="", ylab="")

#Get the y-axis data and add the lines and label
pardat<-par()
yaxisdat<-seq(pardat$yaxp[1],pardat$yaxp[2],(pardat$yaxp[2]-pardat$yaxp[1])/pardat$yaxp[3])
axis(2, at=yaxisdat, las=2, padj=0.5, cex.axis=0.8, hadj=0.5, tcl=-0.3)
abline(v=xaxisdat, col="lightgray")
abline(h=yaxisdat, col="lightgray")
mtext("y3", 2, line=2.3)
lines(x, y3, col="green")

#Plot the 4th graph with nothing =================================
plot(x, y4, xlim=range(x), type="n", xaxt="n", yaxt="n", main="", xlab="", ylab="")

#Get the y-axis data and add the lines and label
pardat<-par()
yaxisdat<-seq(pardat$yaxp[1],pardat$yaxp[2],(pardat$yaxp[2]-pardat$yaxp[1])/pardat$yaxp[3])
axis(2, at=yaxisdat, las=2, padj=0.5, cex.axis=0.8, hadj=0.5, tcl=-0.3)
abline(v=xaxisdat, col="lightgray")
abline(h=yaxisdat, col="lightgray")
mtext("y4", 2, line=2.3)
lines(x, y4, col="darkgray")

#Plot the X axis =================================================
axis(1, at=xaxisdat, padj=-1.4, cex.axis=0.9, hadj=0.5, tcl=-0.3)
mtext("X Variable", 1, line=1.5)
Ci-Dessous est le tracé des graphes.