Comment utiliser les facettes avec un ggplot double axe des y
j'ai essayé d'étendre mon scénario de ici pour faire usage de facettes (spécifiquement facet_grid() ).
j'ai vu cet exemple , cependant je ne peux pas le faire fonctionner pour mon geom_bar() et geom_point() combo. J'ai essayé d'utiliser le code de l'exemple passant de facet_wrap à facet_grid qui semblait aussi faire que la première couche ne s'affiche pas.
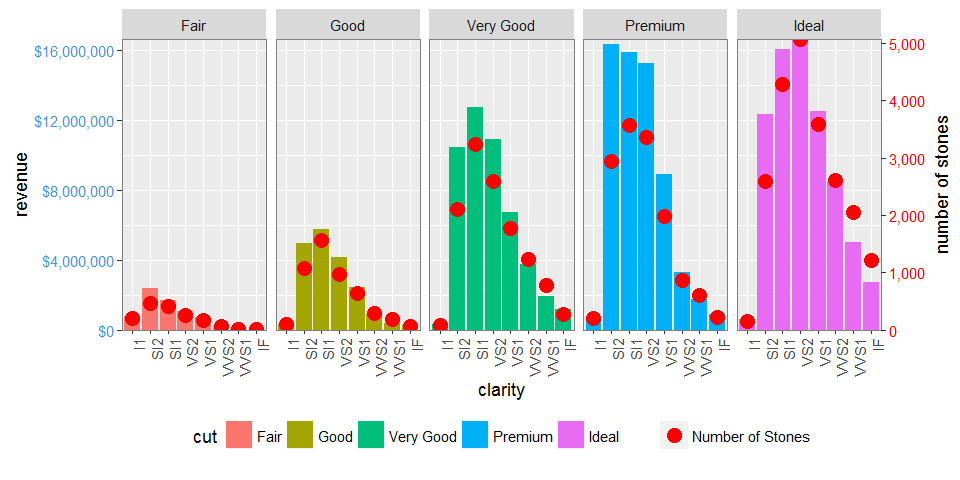
je suis très novice quand il s'agit de grille et de grobs donc si quelqu'un peut donner quelques conseils sur la façon de faire P1 apparaître avec l'axe y de gauche et P2 apparaître sur l'axe y de droite ce serait génial.
Données
library(ggplot2)
library(gtable)
library(grid)
library(data.table)
library(scales)

grid.newpage()

dt.diamonds <- as.data.table(diamonds)

d1 <- dt.diamonds[,list(revenue = sum(price),
                        stones = length(price)),
                  by=c("clarity","cut")]

setkey(d1, clarity,cut)
p1 " et " p2
p1 <- ggplot(d1, aes(x=clarity,y=revenue, fill=cut)) +
  geom_bar(stat="identity") +
  labs(x="clarity", y="revenue") +
  facet_grid(. ~ cut) +
  scale_y_continuous(labels=dollar, expand=c(0,0)) +
  theme(axis.text.x = element_text(angle = 90, hjust = 1),
        axis.text.y = element_text(colour="#4B92DB"),
        legend.position="bottom")

p2 <- ggplot(d1, aes(x=clarity, y=stones, colour="red")) +
  geom_point(size=6) +
  labs(x="", y="number of stones") + expand_limits(y=0) +
  scale_y_continuous(labels=comma, expand=c(0,0)) +
  scale_colour_manual(name = '',values =c("red","green"), labels = c("Number of Stones"))+
  facet_grid(. ~ cut) +
  theme(axis.text.y = element_text(colour = "red")) +
  theme(panel.background = element_rect(fill = NA),
        panel.grid.major = element_blank(),
        panel.grid.minor = element_blank(),
        panel.border = element_rect(fill=NA,colour="grey50"),
        legend.position="bottom")
tentative de combinaison (basée sur l'exemple lié ci-dessus) Cela échoue dans le premier pour loop, I suspect du codage dur de geom_point.points, mais je ne sais pas comment le faire en fonction de mes tableaux (ou assez fluide pour s'adapter à une variété de graphiques)
# extract gtable
g1 <- ggplot_gtable(ggplot_build(p1))
g2 <- ggplot_gtable(ggplot_build(p2))

combo_grob <- g2
pos <- length(combo_grob) - 1
combo_grob$grobs[[pos]] <- cbind(g1$grobs[[pos]],
                                 g2$grobs[[pos]], size = 'first')

panel_num <- length(unique(d1$cut))
for (i in seq(panel_num))
{
   grid.ls(g1$grobs[[i + 1]])
  panel_grob <- getGrob(g1$grobs[[i + 1]], 'geom_point.points',
                        grep = TRUE, global = TRUE)
  combo_grob$grobs[[i + 1]] <- addGrob(combo_grob$grobs[[i + 1]],
                                       panel_grob)
}


pos_a <- grep('axis_l', names(g1$grobs))
axis <- g1$grobs[pos_a]
for (i in seq(along = axis))
{
  if (i %in% c(2, 4))
  {
    pp <- c(subset(g1$layout, name == paste0('panel-', i), se = t:r))

    ax <- axis[[1]]$children[[2]]
    ax$widths <- rev(ax$widths)
    ax$grobs <- rev(ax$grobs)
    ax$grobs[[1]]$x <- ax$grobs[[1]]$x - unit(1, "npc") + unit(0.5, "cm")
    ax$grobs[[2]]$x <- ax$grobs[[2]]$x - unit(1, "npc") + unit(0.8, "cm")
    combo_grob <- gtable_add_cols(combo_grob, g2$widths[g2$layout[pos_a[i],]$l], length(combo_grob$widths) - 1)
    combo_grob <- gtable_add_grob(combo_grob, ax,  pp$t, length(combo_grob$widths) - 1, pp$b)
  }
}

pp <- c(subset(g1$layout, name == 'ylab', se = t:r))

ia <- which(g1$layout$name == "ylab")
ga <- g1$grobs[[ia]]
ga$rot <- 270
ga$x <- ga$x - unit(1, "npc") + unit(1.5, "cm")

combo_grob <- gtable_add_cols(combo_grob, g2$widths[g2$layout[ia,]$l], length(combo_grob$widths) - 1)
combo_grob <- gtable_add_grob(combo_grob, ga, pp$t, length(combo_grob$widths) - 1, pp$b)
combo_grob$layout$clip <- "off"

grid.draw(combo_grob)
ÉDITER " pour tenter de rendre réalisable pour facet_wrap
le code suivant fonctionne toujours avec facet_grid en utilisant ggplot2 2.0.0
g1 <- ggplot_gtable(ggplot_build(p1))
g2 <- ggplot_gtable(ggplot_build(p2))

pp <- c(subset(g1$layout, name == "panel", se = t:r))
g <- gtable_add_grob(g1, g2$grobs[which(g2$layout$name == "panel")], pp$t,
                     pp$l, pp$b, pp$l)
# axis tweaks
ia <- which(g2$layout$name == "axis-l")
ga <- g2$grobs[[ia]]
ax <- ga$children[[2]]
ax$widths <- rev(ax$widths)
ax$grobs <- rev(ax$grobs)
ax$grobs[[1]]$x <- ax$grobs[[1]]$x - unit(1, "npc") + unit(0.15, "cm")
g <- gtable_add_cols(g, g2$widths[g2$layout[ia, ]$l], length(g$widths) - 1)
g <- gtable_add_grob(g, ax, unique(pp$t), length(g$widths) - 1)

# Add second y-axis title
ia <- which(g2$layout$name == "ylab")
ax <- g2$grobs[[ia]]
# str(ax) # you can change features (size, colour etc for these -
# change rotation below
ax$rot <- 90
g <- gtable_add_cols(g, g2$widths[g2$layout[ia, ]$l], length(g$widths) - 1)
g <- gtable_add_grob(g, ax, unique(pp$t), length(g$widths) - 1)

# Add legend to the code
leg1 <- g1$grobs[[which(g1$layout$name == "guide-box")]]
leg2 <- g2$grobs[[which(g2$layout$name == "guide-box")]]

g$grobs[[which(g$layout$name == "guide-box")]] <-
  gtable:::cbind_gtable(leg1, leg2, "first")

grid.draw(g)
2 réponses
EDIT: UPDATED TO GGPLOT 2.2.0
Mais ggplot2 supporte maintenant les axes secondaires y, donc il n'y a pas besoin de manipulation grob. Voir la solution de @Axeman.
facet_grid et facet_wrap génèrent différents ensembles de noms pour les panneaux de placettes et les axes de gauche. Vous pouvez vérifier les noms en utilisant g1$layout où g1 <- ggplotGrob(p1) , et p1 est dessiné en premier avec facet_grid() , puis en second avec facet_wrap() . En particulier, avec facet_grid() le parcelle panneaux sont tous nommés "panneau de configuration", alors qu'avec facet_wrap() ils ont des noms différents: "panneau-1", "panneau-2", et ainsi de suite. Ainsi les commandes comme celles-ci:
pp <- c(subset(g1$layout, name == "panel", se = t:r))
g <- gtable_add_grob(g1, g2$grobs[which(g2$layout$name == "panel")], pp$t,
                     pp$l, pp$b, pp$l)
échouera avec les tracés générés en utilisant facet_wrap . J'utiliserais des expressions régulières pour sélectionner tous les noms commençant par"panel". Il y a des problèmes similaires avec "axis-l".
aussi, vos commandes axis-tweaking ont fonctionné pour les versions plus anciennes de ggplot, mais à partir de la version 2.1.0, le tick les marques ne correspondent pas tout à fait au bord droit de la parcelle, et les marques de tique et les étiquettes de marque de tique sont trop rapprochées.
voici ce que je ferais (dessin sur le code de ici , qui à son tour tire sur le code de ici et de la cowplot package ).
# Packages
library(ggplot2)
library(gtable)
library(grid)
library(data.table)
library(scales)

# Data
dt.diamonds <- as.data.table(diamonds)
d1 <- dt.diamonds[,list(revenue = sum(price),
                        stones = length(price)),
                  by=c("clarity", "cut")]
setkey(d1, clarity, cut)

# The facet_wrap plots
p1 <- ggplot(d1, aes(x = clarity, y = revenue, fill = cut)) +
  geom_bar(stat = "identity") +
  labs(x = "clarity", y = "revenue") +
  facet_wrap( ~ cut, nrow = 1) +
  scale_y_continuous(labels = dollar, expand = c(0, 0)) +
  theme(axis.text.x = element_text(angle = 90, hjust = 1),
        axis.text.y = element_text(colour = "#4B92DB"),
        legend.position = "bottom")

p2 <- ggplot(d1, aes(x = clarity, y = stones, colour = "red")) +
  geom_point(size = 4) +
  labs(x = "", y = "number of stones") + expand_limits(y = 0) +
  scale_y_continuous(labels = comma, expand = c(0, 0)) +
  scale_colour_manual(name = '', values = c("red", "green"), labels = c("Number of Stones"))+
  facet_wrap( ~ cut, nrow = 1) +
  theme(axis.text.y = element_text(colour = "red")) +
  theme(panel.background = element_rect(fill = NA),
        panel.grid.major = element_blank(),
        panel.grid.minor = element_blank(),
        panel.border = element_rect(fill = NA, colour = "grey50"),
        legend.position = "bottom")


# Get the ggplot grobs
g1 <- ggplotGrob(p1)
g2 <- ggplotGrob(p2)

# Get the locations of the plot panels in g1.
pp <- c(subset(g1$layout, grepl("panel", g1$layout$name), se = t:r))

# Overlap panels for second plot on those of the first plot
g <- gtable_add_grob(g1, g2$grobs[grepl("panel", g1$layout$name)],
      pp$t, pp$l, pp$b, pp$l)


# ggplot contains many labels that are themselves complex grob;
# usually a text grob surrounded by margins.
# When moving the grobs from, say, the left to the right of a plot,
# Make sure the margins and the justifications are swapped around.
# The function below does the swapping.
# Taken from the cowplot package:
# https://github.com/wilkelab/cowplot/blob/master/R/switch_axis.R

hinvert_title_grob <- function(grob){

  # Swap the widths
  widths <- grob$widths
  grob$widths[1] <- widths[3]
  grob$widths[3] <- widths[1]
  grob$vp[[1]]$layout$widths[1] <- widths[3]
  grob$vp[[1]]$layout$widths[3] <- widths[1]

  # Fix the justification
  grob$children[[1]]$hjust <- 1 - grob$children[[1]]$hjust
  grob$children[[1]]$vjust <- 1 - grob$children[[1]]$vjust
  grob$children[[1]]$x <- unit(1, "npc") - grob$children[[1]]$x
  grob
}

# Get the y axis title from g2
index <- which(g2$layout$name == "ylab-l") # Which grob contains the y axis title?   EDIT HERE
ylab <- g2$grobs[[index]]                # Extract that grob
ylab <- hinvert_title_grob(ylab)         # Swap margins and fix justifications

# Put the transformed label on the right side of g1
g <- gtable_add_cols(g, g2$widths[g2$layout[index, ]$l], max(pp$r))
g <- gtable_add_grob(g, ylab, max(pp$t), max(pp$r) + 1, max(pp$b), max(pp$r) + 1, clip = "off", name = "ylab-r")

# Get the y axis from g2 (axis line, tick marks, and tick mark labels)
index <- which(g2$layout$name == "axis-l-1-1")  # Which grob.    EDIT HERE
yaxis <- g2$grobs[[index]]                    # Extract the grob

# yaxis is a complex of grobs containing the axis line, the tick marks, and the tick mark labels.
# The relevant grobs are contained in axis$children:
#   axis$children[[1]] contains the axis line;
#   axis$children[[2]] contains the tick marks and tick mark labels.

# First, move the axis line to the left
# But not needed here
# yaxis$children[[1]]$x <- unit.c(unit(0, "npc"), unit(0, "npc"))

# Second, swap tick marks and tick mark labels
ticks <- yaxis$children[[2]]
ticks$widths <- rev(ticks$widths)
ticks$grobs <- rev(ticks$grobs)

# Third, move the tick marks
# Tick mark lengths can change.
# A function to get the original tick mark length
# Taken from the cowplot package:
# https://github.com/wilkelab/cowplot/blob/master/R/switch_axis.R
plot_theme <- function(p) {
  plyr::defaults(p$theme, theme_get())
}

tml <- plot_theme(p1)$axis.ticks.length   # Tick mark length
ticks$grobs[[1]]$x <- ticks$grobs[[1]]$x - unit(1, "npc") + tml

# Fourth, swap margins and fix justifications for the tick mark labels
ticks$grobs[[2]] <- hinvert_title_grob(ticks$grobs[[2]])

# Fifth, put ticks back into yaxis
yaxis$children[[2]] <- ticks

# Put the transformed yaxis on the right side of g1
g <- gtable_add_cols(g, g2$widths[g2$layout[index, ]$l], max(pp$r))
g <- gtable_add_grob(g, yaxis, max(pp$t), max(pp$r) + 1, max(pp$b), max(pp$r) + 1,
   clip = "off", name = "axis-r")

# Get the legends
leg1 <- g1$grobs[[which(g1$layout$name == "guide-box")]]
leg2 <- g2$grobs[[which(g2$layout$name == "guide-box")]]

# Combine the legends
g$grobs[[which(g$layout$name == "guide-box")]] <-
    gtable:::cbind_gtable(leg1, leg2, "first")

# Draw it
grid.newpage()
grid.draw(g)
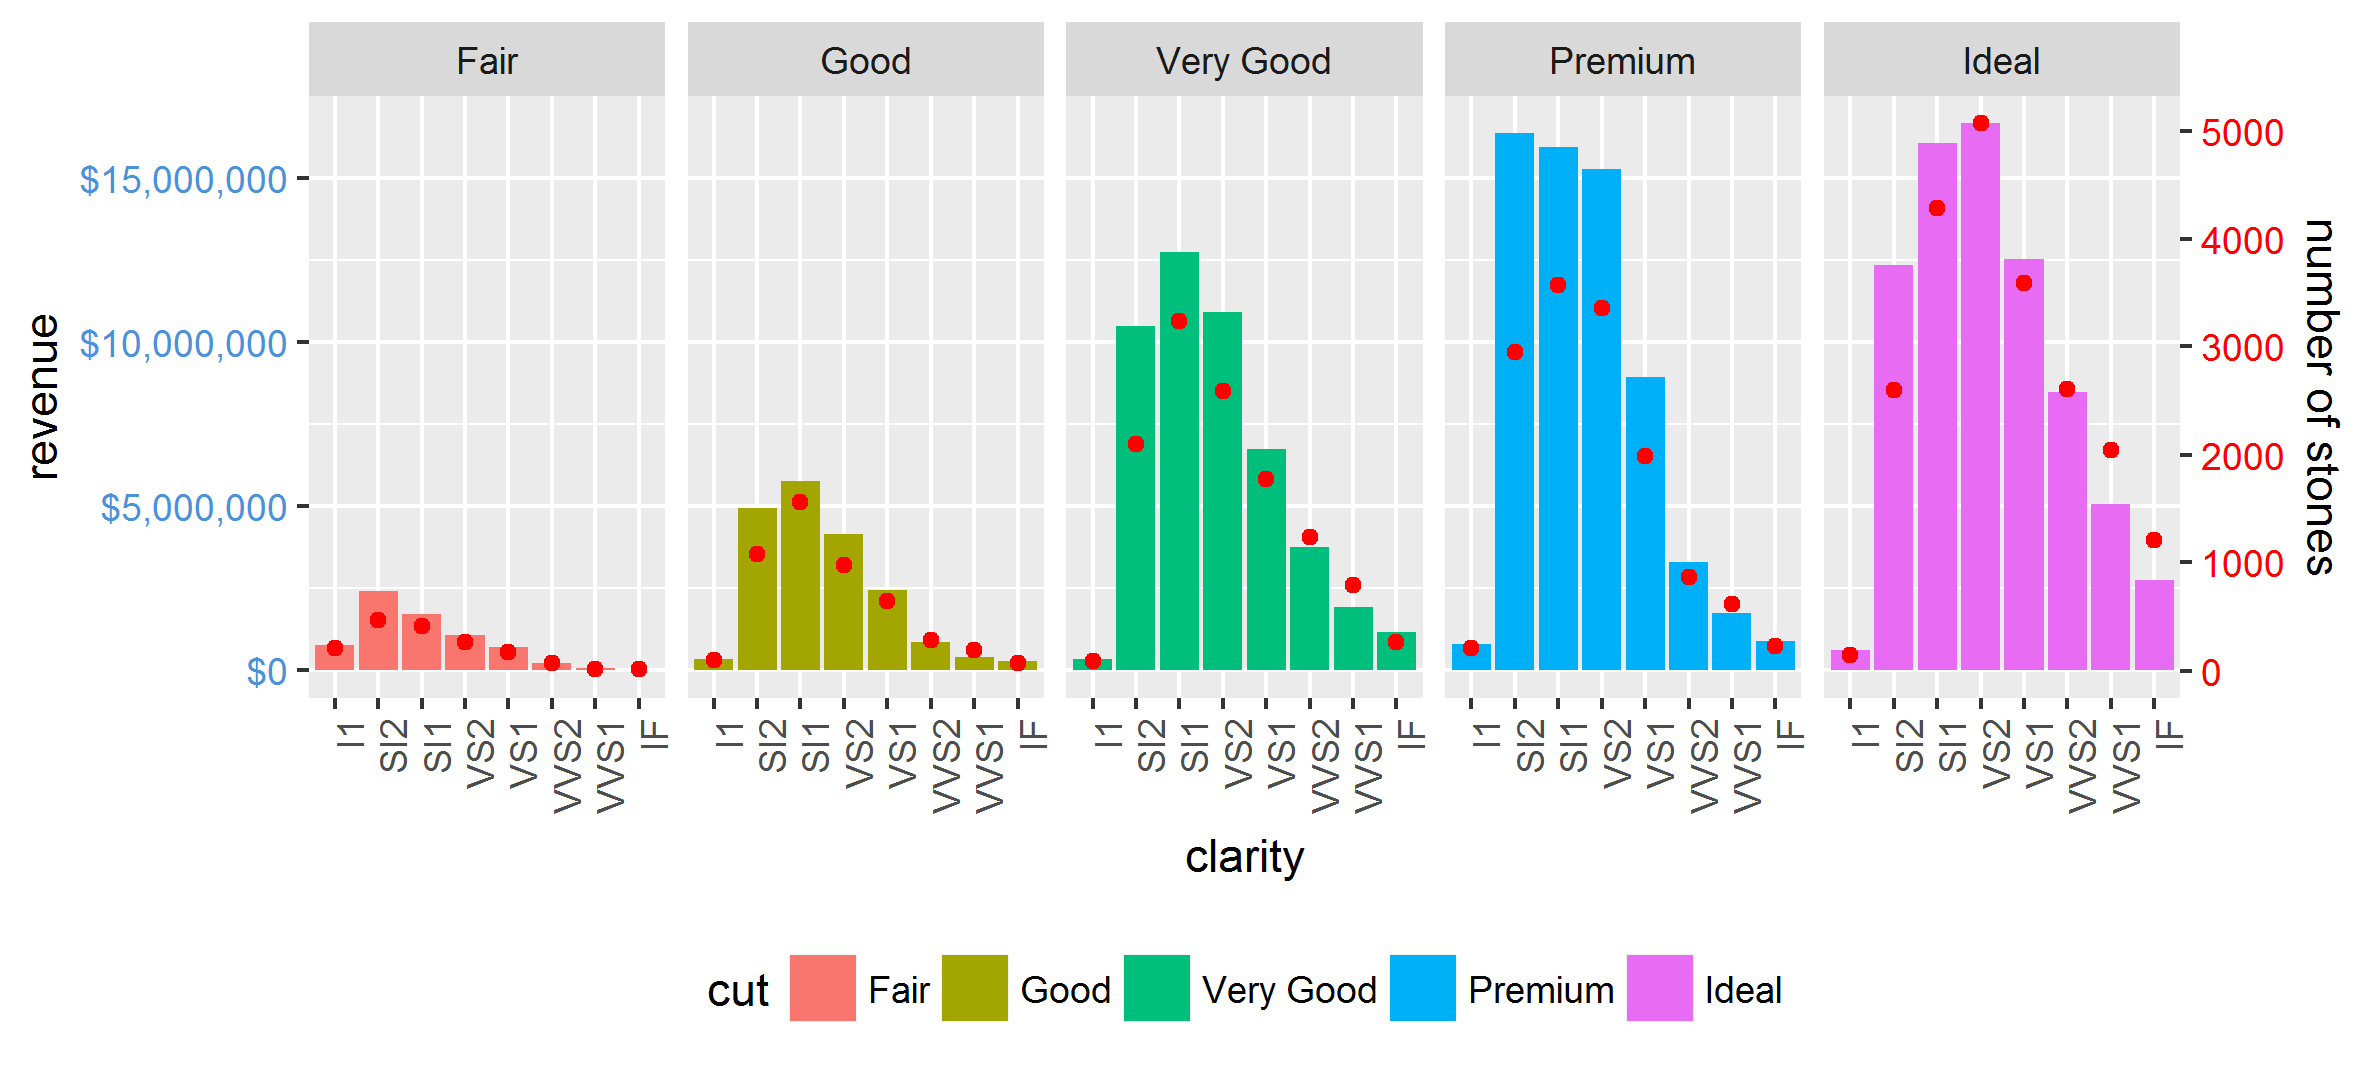
maintenant que ggplot2 a le support d'axe secondaire ceci est devenu beaucoup plus facile dans beaucoup de cas (mais pas tous ). Pas besoin de manipulation grob.
même s'il est supposé ne permettre que des transformations linéaires simples des mêmes données, comme des échelles de mesure différentes, nous pouvons rééchelonner manuellement une des variables d'abord pour au moins tirer beaucoup plus de cette propriété.
library(tidyverse)

max_stones <- max(d1$stones)
max_revenue <- max(d1$revenue)

d2 <- gather(d1, 'var', 'val', stones:revenue) %>%
  mutate(val = if_else(var == 'revenue', as.double(val), val / (max_stones / max_revenue)))

ggplot(mapping = aes(clarity, val)) +
  geom_bar(aes(fill = cut), filter(d2, var == 'revenue'), stat = 'identity') +
  geom_point(data = filter(d2, var == 'stones'), col = 'red') +
  facet_grid(~cut) +
  scale_y_continuous(sec.axis = sec_axis(trans = ~ . * (max_stones / max_revenue),
                                         name = 'number of stones'),
                     labels = dollar) +
  theme(axis.text.x = element_text(angle = 90, hjust = 1),
        axis.text.y = element_text(color = "#4B92DB"),
        axis.text.y.right = element_text(color = "red"),
        legend.position="bottom") +
  ylab('revenue')
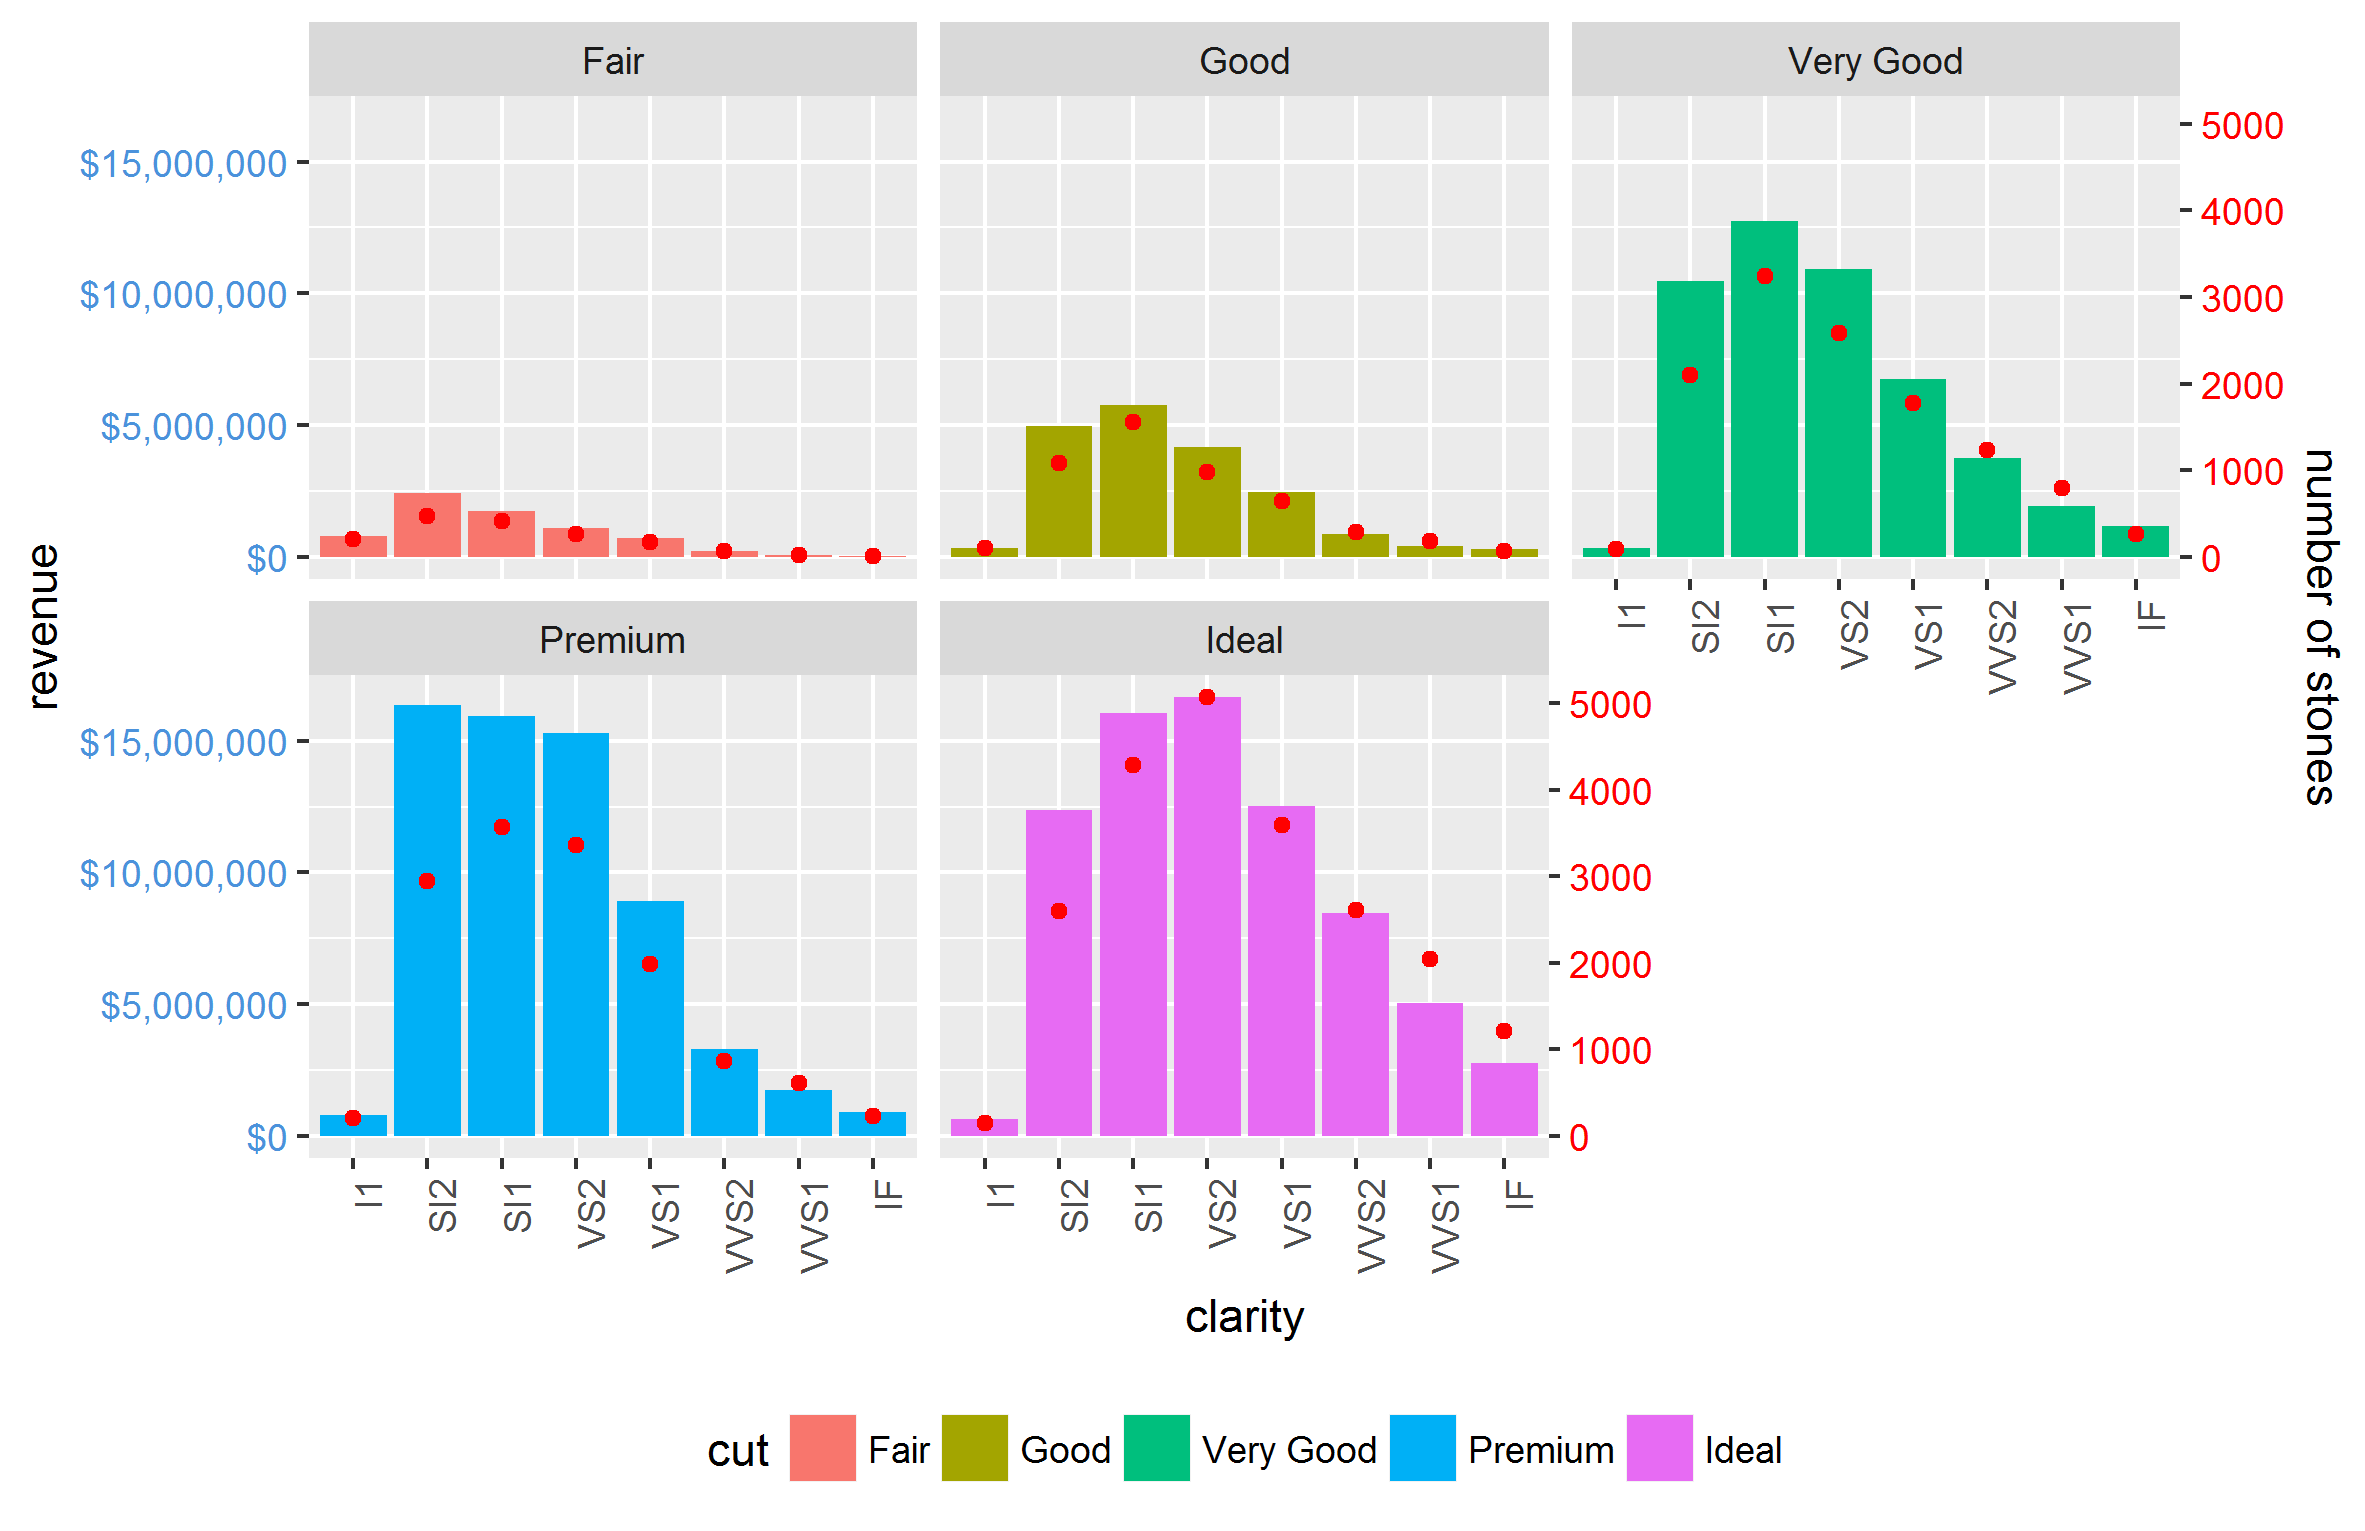
il fonctionne aussi bien avec facet_wrap :
d'autres complications, telles que scales = 'free' et space = 'free' sont également faites facilement. La seule restriction est que la relation entre les deux axes est égale pour toutes les facettes.


