Comment créer un nuage de mots à partir d'un corpus en Python?
à Partir de la Création d'un sous-ensemble de mots à partir d'un corpus dans la R , le répondeur peut facilement convertir un term-document matrix dans un nuage de mots facilement.
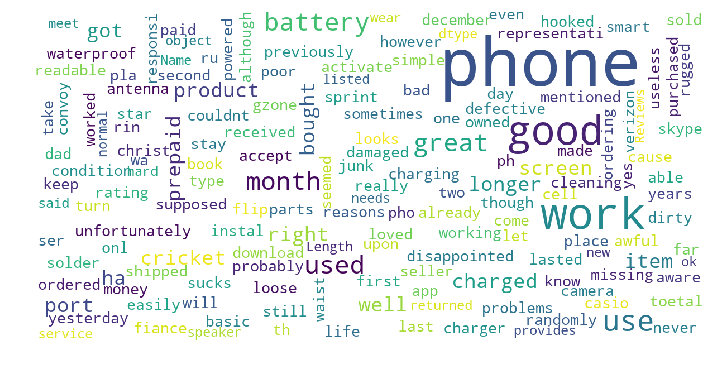
est-ce qu'il y a une fonction similaire dans les bibliothèques python qui prend soit un fichier texte brut ou NLTK corpus ou Gensim Mmcorpus dans un nuage de mots?
le résultat ressemblera un peu à ceci:

5 réponses
voici un billet de blog qui fait justement cela: http://peekaboo-vision.blogspot.com/2012/11/a-wordcloud-in-python.html
le code entier est ici: https://github.com/amueller/word_cloud
si vous avez besoin de ces mots clouds pour les afficher sur un site web ou une application web, vous pouvez convertir vos données au format JSON ou csv et les charger dans une bibliothèque de visualisation JavaScript telle que d3 . Nuages de mots sur d3
sinon, la réponse de Marcin est une bonne façon de faire ce que vous décrivez.
exemple du code d'amueller en action
en ligne de commande / terminal:
sudo pip install wordcloud
puis lancez le script python:
## Simple WordCloud
import matplotlib.pyplot as plt
from wordcloud import WordCloud, STOPWORDS

text = 'all your base are belong to us all of your base base base'

def generate_wordcloud(text): # optionally add: stopwords=STOPWORDS and change the arg below
    wordcloud = WordCloud(font_path='/Library/Fonts/Verdana.ttf',
                          relative_scaling = 1.0,
                          stopwords = {'to', 'of'} # set or space-separated string
                          ).generate(text)
    plt.imshow(wordcloud)
    plt.axis("off")
    plt.show()

generate_wordcloud(text)
from wordcloud import WordCloud, STOPWORDS
import matplotlib.pyplot as plt
stopwords = set(STOPWORDS)

def show_wordcloud(data, title = None):
    wordcloud = WordCloud(
        background_color='white',
        stopwords=stopwords,
        max_words=200,
        max_font_size=40,
        scale=3,
        random_state=1 # chosen at random by flipping a coin; it was heads
    ).generate(str(data))

    fig = plt.figure(1, figsize=(12, 12))
    plt.axis('off')
    if title:
        fig.suptitle(title, fontsize=20)
        fig.subplots_adjust(top=2.3)

    plt.imshow(wordcloud)
    plt.show()

show_wordcloud(Samsung_Reviews_Negative['Reviews'])
show_wordcloud(Samsung_Reviews_positive['Reviews'])
voici le code court
#make wordcoud

from wordcloud import WordCloud, STOPWORDS
import matplotlib.pyplot as plt
stopwords = set(STOPWORDS)

def show_wordcloud(data, title = None):
    wordcloud = WordCloud(
        background_color='white',
        stopwords=stopwords,
        max_words=200,
        max_font_size=40,
        scale=3,
        random_state=1 # chosen at random by flipping a coin; it was heads
    ).generate(str(data))

    fig = plt.figure(1, figsize=(12, 12))
    plt.axis('off')
    if title:
        fig.suptitle(title, fontsize=20)
        fig.subplots_adjust(top=2.3)

    plt.imshow(wordcloud)
    plt.show()


if __name__ == '__main__':

    show_wordcloud(text_str)

