comment annoter heatmap avec du texte dans matplotlib?
je trace un heatmap dans matplotlib en utilisant:
plt.pcolor(rand(5,5))
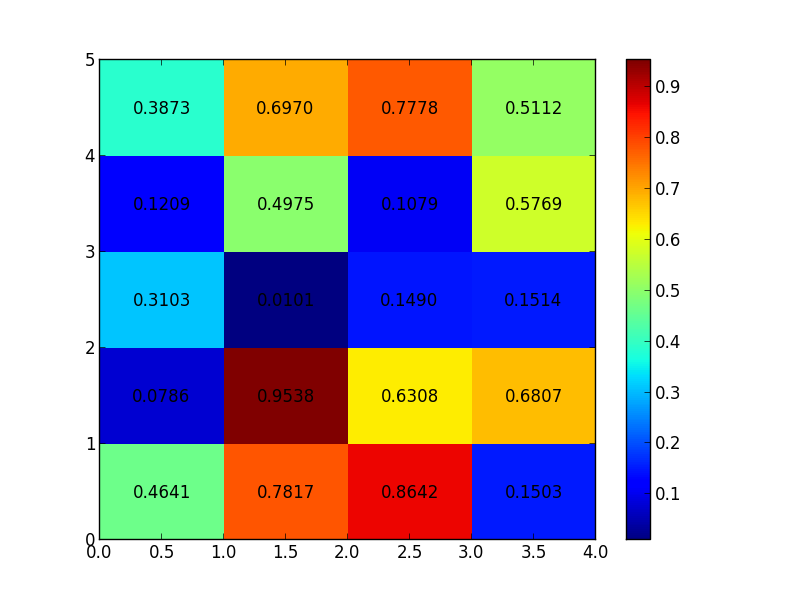
comment puis-je annoter la heatmap avec les chiffres réels tracée? c'est-à-dire que dans chaque cellule de heatmap tracée, mettez la valeur correspondant à cette cellule dans la matrice 5x5 passée à pcolor. grâce.
23
demandé sur
user248237dfsf
2012-08-12 00:48:47
2 réponses
Il n'y a pas de fonction automatique pour faire une telle chose, mais vous pouvez boucler chaque point et mettre du texte à l'endroit approprié:
import matplotlib.pyplot as plt
import numpy as np

data = np.random.rand(5, 4)
heatmap = plt.pcolor(data)

for y in range(data.shape[0]):
    for x in range(data.shape[1]):
        plt.text(x + 0.5, y + 0.5, '%.4f' % data[y, x],
                 horizontalalignment='center',
                 verticalalignment='center',
                 )

plt.colorbar(heatmap)

plt.show()

HTH
41
répondu
pelson
2012-08-11 22:18:15
Le Seaborn heatmap fait le travail automatiquement, en définissant annot=True.
5
répondu
user56643
2016-07-02 09:24:12