Comment ajouter le contrôle de barre de progression à Gui Matlab?
y a-t-il une barre de progression prête à être ajoutée à Matlab gui, UIControl ou ActiveX component?
[edit] je sais À propos de la fonction waitbar, je voulais dire un composant qui peut être implémenté dans l'interface graphique conçue et pas simplement sortir par la fenêtre. Quelque chose comme l'état de la batterie dans la barre d'état.
7 réponses
Waitbar et ses variantes affichent une fenêtre popup avec une barre d'état. Dans la plupart des applications, c'est correct et très simple à utiliser.
si vous voulez intégrer une barre de progression dans une fenêtre GUI existante, vous avez plusieurs choix:
- implémenter le code interne de la barre d'attente - c'est vraiment juste un axe qui présente un patch coloré dont la largeur dépend de la valeur de progression.
- utilisez la norme java.swing.JProgressBar, qui peut être ajouté à votre GUI Matlab via le javacomponent fonction
- Barre d'état de l'utilitaire ou l'explication ici pour ajouter une barre de progression à la barre de statut de votre fenêtre GUI
tous ces choix fonctionnent sur toutes les plateformes de Matlab.
adapter mon code de ceci MatLab Newgroup commentaire, j'ai été en mesure de mettre ensemble ce qui suit:
function h = uiProgressBar(varargin)
%uiProgressBar: A waitbar that can be embedded in a GUI figure.

    if ishandle(varargin{1}) && size(varargin, 2) > 1
        ax = varargin{1};
        value = varargin{2};
        p = get(ax,'Child');
        x = get(p,'XData');
        x(3:4) = value;
        set(p,'XData',x)
        return
    end

    bg_color = 'w';
    fg_color = 'r';
    h = axes('Units','pixels',...
        'XLim',[0 1],'YLim',[0 1],...
        'XTick',[],'YTick',[],...
        'Color',bg_color,...
        'XColor',bg_color,'YColor',bg_color, ...
        'Parent', varargin{1});
    patch([0 0 0 0],[0 1 1 0],fg_color,...
        'Parent',h,...
        'EdgeColor','none',...
        'EraseMode','none');
end
Création est la suivante, où parent est le parent panneau que vous souhaitez ajouter à:
myProgressBar = uiProgressBar(parent);
et mettre à jour la barre de progression est aussi simple que ceci:
uiProgressBar(myProgressBar, .2);
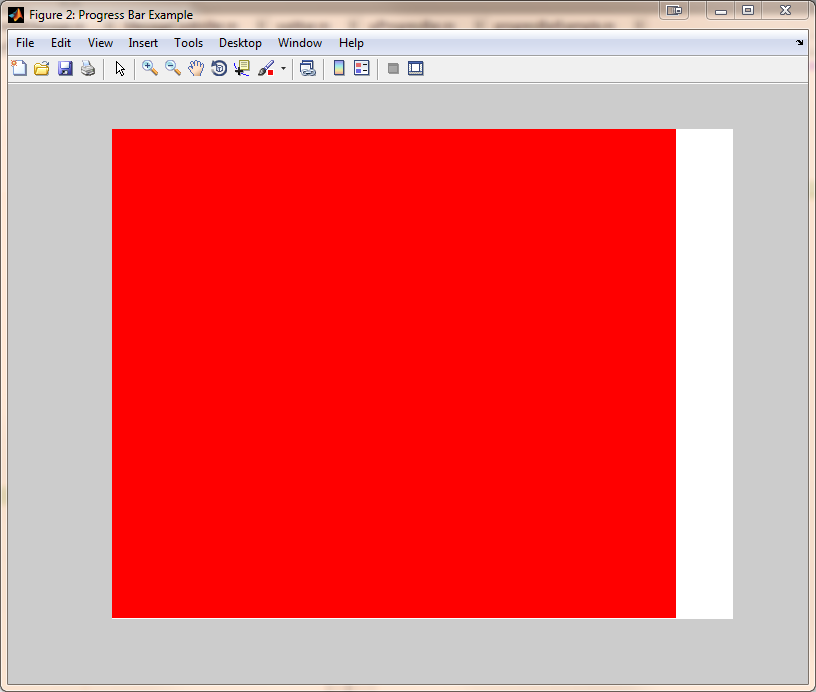
voici un exemple complet utilisant un figure:
f = figure('Name', 'Progress Bar Example', 'Position', [100 100 800 600]);

progressBar = uiProgressBar(f);

for i = 1:10:100
    uiProgressBar(progressBar, i/100);
    pause(.5);
end
une autre solution simple est d'utiliser deux uipanels imbriqués comme ceci:
function MyProgressBar(handle, progress)
   % progress = 0.00001 .... 1

   % 1st panel
   p = uipanel(handle);

   % 2n panel as bar
   bar = uipanel(p);
    set(bar, 'BackgroundColor', 'red');
    x = get(bar, 'Position');
    x(3) = progress;       % Corresponds to % progress if unit = normalized
    set(bar, 'Position',x);
end
Utilisation:
 f = figure();
 set(f,'Position',[100,100,400,40]);
 MyProgressBar(f, 0.5); % corresponds to 50% progress
pour ceux qui sont encore intéressés, voici ma solution en utilisant une classe:
classdef progressbar < handle
    properties(Access = protected)
        h_panel         % Panel on which everything sits
        h_ax            % The progress range axes
        h_pbar          % The bar representing progress (patch)
        h_ptext         % Percentage label
    end
    properties(Access = public, Dependent = true)
        range           % Progress range
        pvalue          % Current value
        percent         % Percentage complete (relative within range)
        position        % Position of the object (panel)
        ax_tag          % Tag of the axes
        visible         % Is the object (panel) visible?
    end
    properties(Constant = true)
        default_color = [.75 .75 .9];
    end
    methods
        % Initializer
        function obj = progressbar(fig, pos, range)
            if nargin < 3
                range = [0 1];
            end
            obj.h_panel = uipanel('Parent', fig, 'Units', 'Inches', ...
                'Position', pos, 'Tag', 'progbar_panel');
            obj.h_ax = axes('Parent', obj.h_panel, ...
                'Units', 'Inches', 'Position', [0 0 obj.position(3) obj.position(4)], ...
                'XTickLabel', '', 'XTick', [], 'YTickLabel', '', 'YTick', []);
            obj.h_pbar = patch([range(1) range(1) range(1) range(1)], [0 0 2 2], ...
                obj.default_color, 'Parent', obj.h_ax, 'Tag', 'progbar_patch');
            obj.h_ptext = text(obj.position(3)/2, obj.position(4)/2, '0%', ...
                'Parent', obj.h_ax, 'FontWeight', 'bold', 'Units', 'Inches', ...
                'HorizontalAlignment', 'center', 'Tag', 'progbar_text');
            obj.range = range;
            obj.ax_tag = 'progbar_ax';
        end

        % Property Access Methods
        function set.range(obj, value)
            % Instead of replotting, just reset the XLim to the
            % extremities of the input range. If the values are not
            % increasing, just default to [0 1].
            if value(end) > value(1)
                set(obj.h_ax, 'XLim', value([1,end]), 'YLim', [0 2]);
            else
                set(obj.h_ax, 'XLim', [0 1], 'YLim', [0 2]);
            end
            % Reset progress.
            obj.pvalue = value(1);
        end
        function value = get.range(obj)
            value = get(obj.h_ax, 'XLim');
        end
        function set.pvalue(obj, value)
            % Expects a single value to represent progress value and
            % constructs the selection rectangle from that. If multiple
            % values are passed in, all are ignored but the last, since the
            % left edge of the bar is always the first element of the
            % range.
            set(obj.h_pbar, 'XData', [obj.range(1) value(end) value(end) obj.range(1)], ...
                'FaceColor', obj.default_color);
            set(obj.h_ptext, 'String', sprintf('%3.0f%%', obj.percent * 100));
        end
        function value = get.pvalue(obj)
            % The progress bar is actually 2D, but we treat as if it is 1D.
            % Hence the XData is actually an array of four values but we
            % only consider the second (progress maximum).
            limits = get(obj.h_pbar, 'XData');
            value = limits(2);
        end
        function set.percent(obj, value)
            % Expects a single value between 0 and 1.
            limits = obj.range;
            obj.pvalue = value * (limits(2) - limits(1)) + limits(1);
        end
        function value = get.percent(obj)
            limits = obj.range;
            value = (obj.pvalue - limits(1)) / (limits(2) - limits(1));
        end
        function set.position(obj, value)
            set(obj.h_panel, 'Position', value);
        end
        function value = get.position(obj)
            value = get(obj.h_panel, 'Position');
        end
        function set.ax_tag(obj, value)
            set(obj.h_ax, 'Tag', value);
        end
        function value = get.ax_tag(obj)
            value = get(obj.h_ax, 'Tag');
        end
        function set.visible(obj, value)
            if (isnumeric(value) && value >= 1) || strcmp(value, 'on') == 1 || strcmp(value, 'On') == 1
                set(obj.h_panel, 'Visible', 'on');
            else
                set(obj.h_panel, 'Visible', 'off');
            end
        end
        function value = get.visible(obj)
            vis = get(obj.h_panel, 'Visible');
            value = strcmp(vis, 'on');
        end

        % Public member functions
        function increment(obj)
            % Don't use this if the range is less than 1.
            obj.pvalue = obj.pvalue + 1;
        end
        function display_text(obj, text, color)
            if nargin == 3 && ~isempty(color)
                set(obj.h_pbar, 'FaceColor', color);
            end
            set(obj.h_ptext, 'String', text);
        end
    end
end
Déclarer une instance de la sorte: pb = progressbar(gcf, [1 1], [0 20]);
il peut être utilisé avec des nombres relatifs ou réels, c.-à-d. pb.pvalue = 10; et pb.percent = .5; faire la même chose dans mon exemple.
ma version comporte un objet texte au milieu de la barre de progression qui affiche le pourcentage courant.
ma dernière version est disponible ici.
Matlab a construit 'waitbar'... vous pouvez aussi utiliser l'un de ces outils sur le site de matlab:
http://www.mathworks.com/matlabcentral/fileexchange/26773-progress-bar&watching=26773
http://www.mathworks.com/matlabcentral/fileexchange/3607-progressbar
Il existe une autre manière... Désolé si ça a été mentionné et que je l'ai manqué. Vous pouvez construire une figure en ajoutant dynamiquement les axes pour une barre.. Il fonctionne très bien et facilement adaptable pour des applications personnalisées. Les Pop-ups se perdaient ou gênaient.