ggplot2 tarte et beignet sur la même parcelle
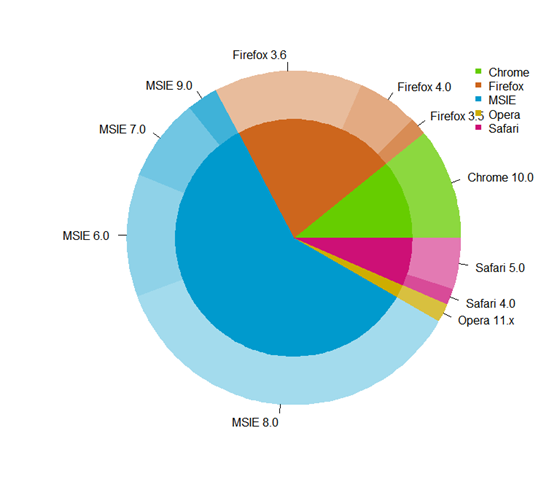
j'essaie de répliquer ce 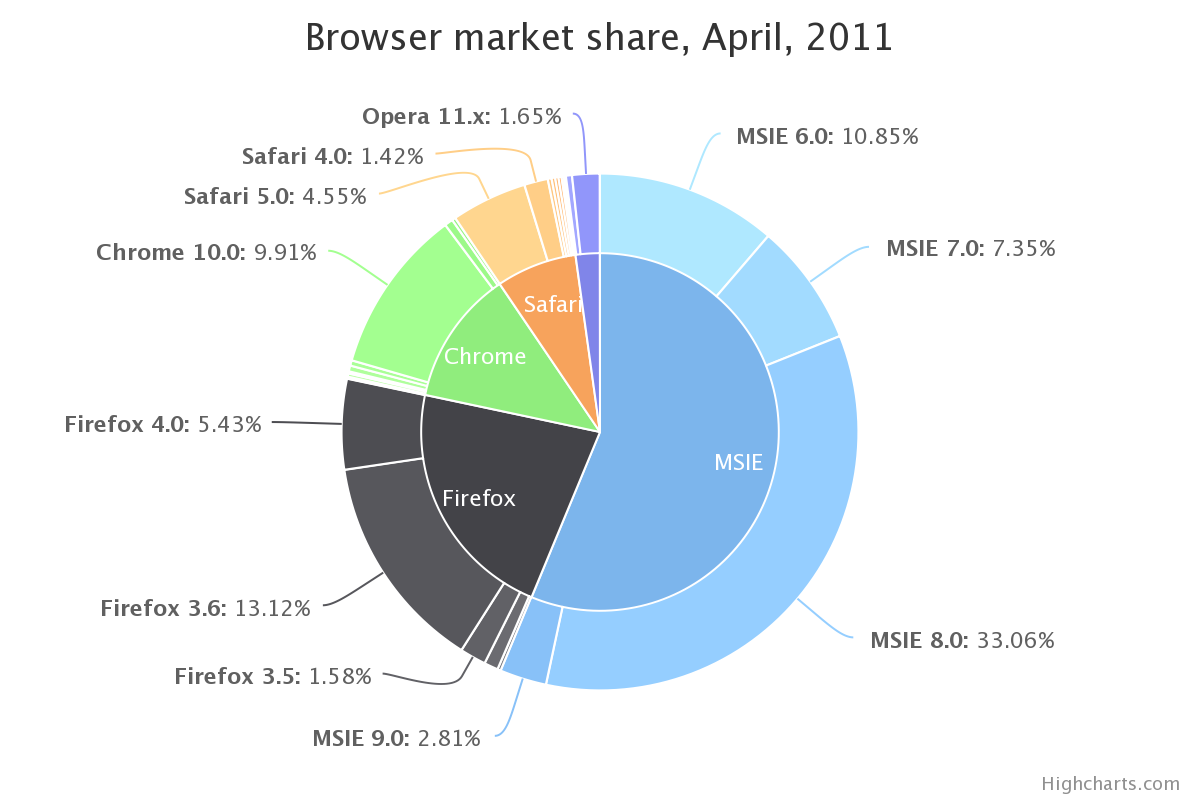 avec R ggplot. J'ai exactement les mêmes données:
browsers<-structure(list(browser = structure(c(3L, 3L, 3L, 3L, 2L, 2L,
2L, 1L, 5L, 5L, 4L), .Label = c("Chrome", "Firefox", "MSIE",
"Opera", "Safari"), class = "factor"), version = structure(c(5L,
6L, 7L, 8L, 2L, 3L, 4L, 1L, 10L, 11L, 9L), .Label = c("Chrome 10.0",
"Firefox 3.5", "Firefox 3.6", "Firefox 4.0", "MSIE 6.0", "MSIE 7.0",
"MSIE 8.0", "MSIE 9.0", "Opera 11.x", "Safari 4.0", "Safari 5.0"
), class = "factor"), share = c(10.85, 7.35, 33.06, 2.81, 1.58,
13.12, 5.43, 9.91, 1.42, 4.55, 1.65), ymax = c(10.85, 18.2, 51.26,
54.07, 55.65, 68.77, 74.2, 84.11, 85.53, 90.08, 91.73), ymin = c(0,
10.85, 18.2, 51.26, 54.07, 55.65, 68.77, 74.2, 84.11, 85.53,
90.08)), .Names = c("browser", "version", "share", "ymax", "ymin"
), row.names = c(NA, -11L), class = "data.frame")
et il ressemble à ceci:
> browsers
   browser      version  share   ymax   ymin
1     MSIE     MSIE 6.0  10.85  10.85   0.00
2     MSIE     MSIE 7.0   7.35  18.20  10.85
3     MSIE     MSIE 8.0  33.06  51.26  18.20
4     MSIE     MSIE 9.0   2.81  54.07  51.26
5  Firefox  Firefox 3.5   1.58  55.65  54.07
6  Firefox  Firefox 3.6  13.12  68.77  55.65
7  Firefox  Firefox 4.0   5.43  74.20  68.77
8   Chrome  Chrome 10.0   9.91  84.11  74.20
9   Safari   Safari 4.0   1.42  85.53  84.11
10  Safari   Safari 5.0   4.55  90.08  85.53
11   Opera   Opera 11.x   1.65  91.73  90.08
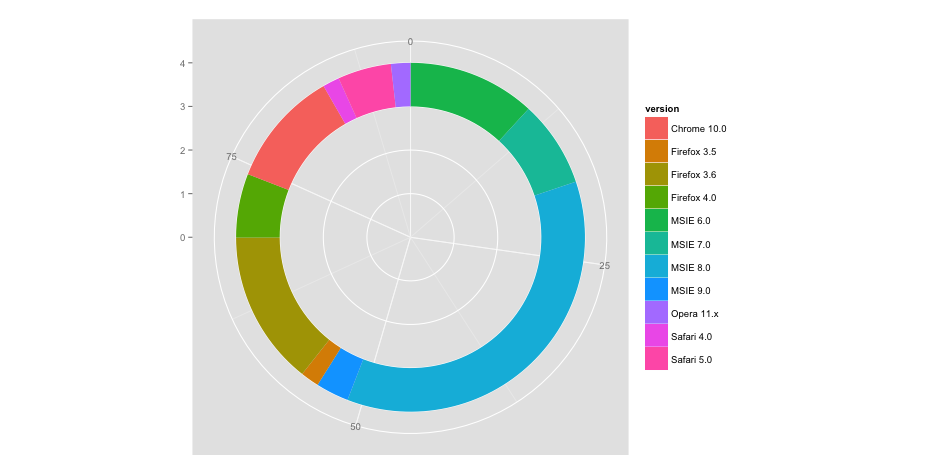
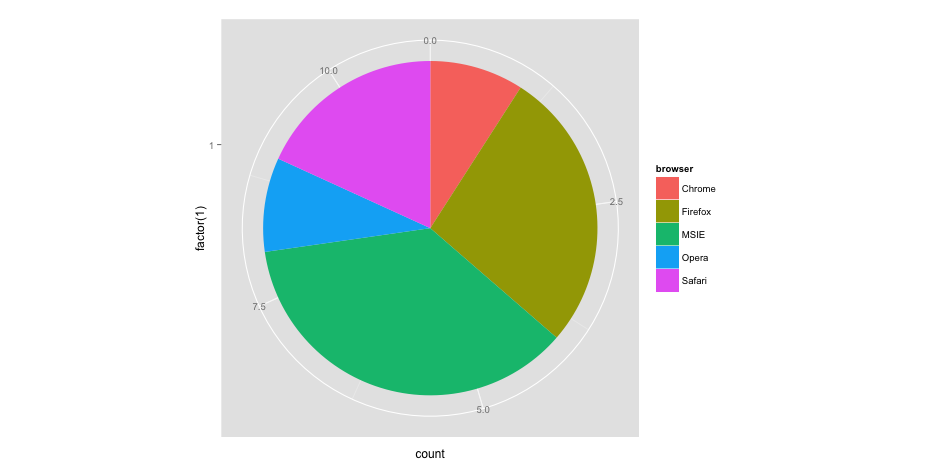
jusqu'à présent, j'ai tracé les composants individuels (c'est à dire le beignet graphique des versions, et le graphique en secteurs des navigateurs) comme suit:
ggplot(browsers) + geom_rect(aes(fill=version, ymax=ymax, ymin=ymin, xmax=4, xmin=3)) +
coord_polar(theta="y") + xlim(c(0, 4))
ggplot(browsers) + geom_bar(aes(x = factor(1), fill = browser),width = 1) +
coord_polar(theta="y")
le problème est, Comment puis-je combiner les deux pour ressembler à l'image la plus haute? J'ai essayé de nombreuses façons telles que:
ggplot(browsers) + geom_rect(aes(fill=version, ymax=ymax, ymin=ymin, xmax=4, xmin=3)) + geom_bar(aes(x = factor(1), fill = browser),width = 1) + coord_polar(theta="y") + xlim(c(0, 4))
mais tous mes résultats sont déformés ou se terminent par un message d'erreur.
5 réponses
je trouve plus facile de travailler en coordonnées rectangulaires d'abord, et quand c'est correct, puis passer aux coordonnées polaires. La coordonnée x devient rayon polaire. Donc, en coordonnées rectangulaires, le tracé intérieur va de zéro à un nombre, comme 3, et la bande extérieure va de 3 à 4.
par exemple
ggplot(browsers) +
  geom_rect(aes(fill=version, ymax=ymax, ymin=ymin, xmax=4, xmin=3)) +
  geom_rect(aes(fill=browser, ymax=ymax, ymin=ymin, xmax=3, xmin=0)) +
  xlim(c(0, 4)) +
  theme(aspect.ratio=1)
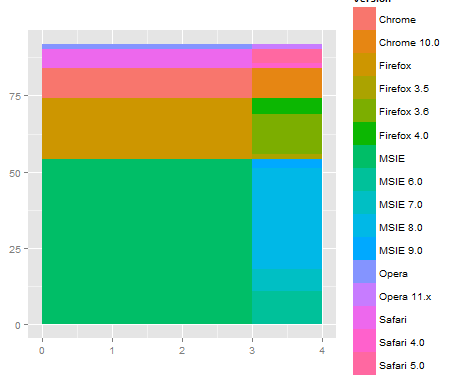
ensuite, quand vous passez à polar, vous obtenez quelque chose comme ce que vous sont à la recherche pour.
ggplot(browsers) +
  geom_rect(aes(fill=version, ymax=ymax, ymin=ymin, xmax=4, xmin=3)) +
  geom_rect(aes(fill=browser, ymax=ymax, ymin=ymin, xmax=3, xmin=0)) +
  xlim(c(0, 4)) +
  theme(aspect.ratio=1) +
  coord_polar(theta="y")
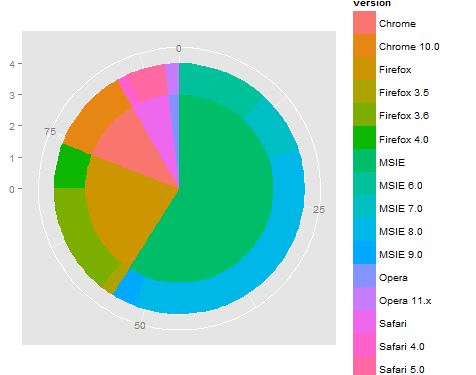
C'est un début, mais peut-être besoin d'affiner la dépendance sur l'axe (ou angle) et aussi travailler sur l'étiquetage / légende / coloriage... En utilisant rect pour les anneaux intérieurs et extérieurs, qui devrait simplifier le réglage de la coloration. De plus, il peut être utile d'utiliser la fonction reshape2::melt pour réorganiser les données afin que la légende apparaisse correctement en utilisant le groupe (ou la couleur).
Edit 2
ma réponse originale est vraiment stupide. Voici une version beaucoup plus courte qui fait la plupart du travail avec une interface beaucoup plus simple.
#' x      numeric vector for each slice
#' group  vector identifying the group for each slice
#' labels vector of labels for individual slices
#' col    colors for each group
#' radius radius for inner and outer pie (usually in [0,1])

donuts <- function(x, group = 1, labels = NA, col = NULL, radius = c(.7, 1)) {
  group <- rep_len(group, length(x))
  ug  <- unique(group)
  tbl <- table(group)[order(ug)]

  col <- if (is.null(col))
    seq_along(ug) else rep_len(col, length(ug))
  col.main <- Map(rep, col[seq_along(tbl)], tbl)
  col.sub  <- lapply(col.main, function(x) {
    al <- head(seq(0, 1, length.out = length(x) + 2L)[-1L], -1L)
    Vectorize(adjustcolor)(x, alpha.f = al)
  })

  plot.new()

  par(new = TRUE)
  pie(x, border = NA, radius = radius[2L],
      col = unlist(col.sub), labels = labels)

  par(new = TRUE)
  pie(x, border = NA, radius = radius[1L],
      col = unlist(col.main), labels = NA)
}

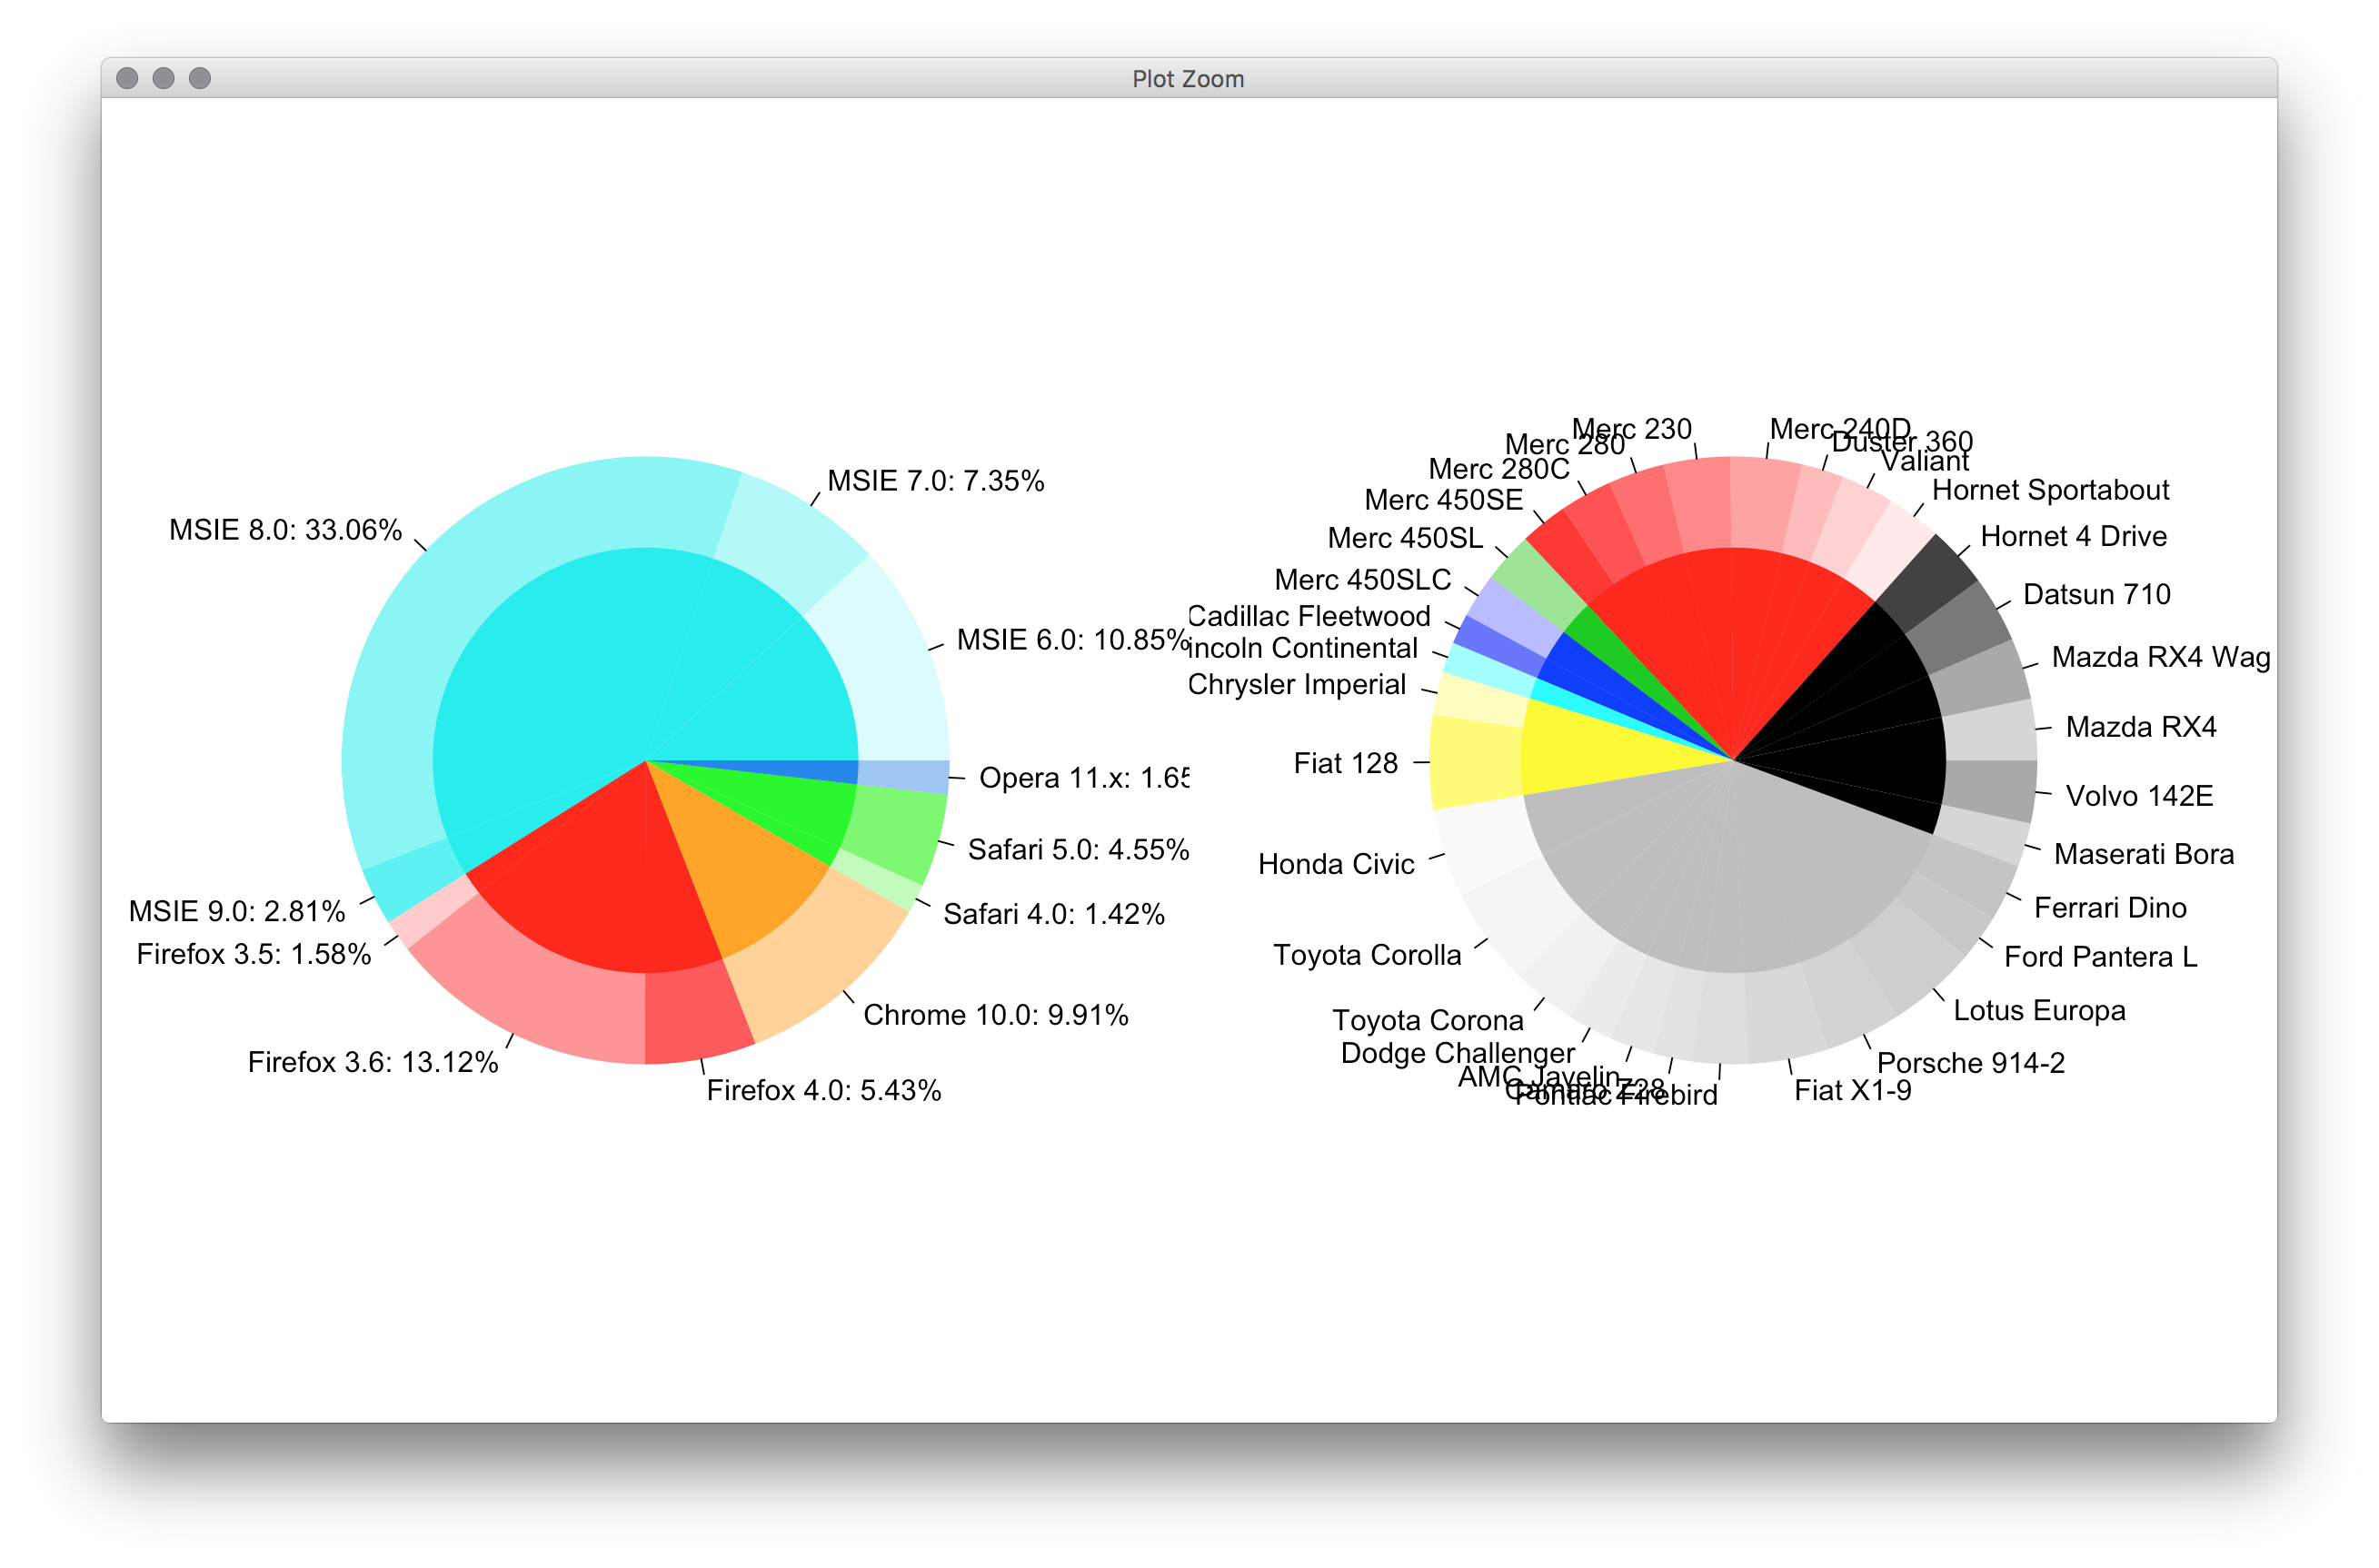
par(mfrow = c(1,2), mar = c(0,4,0,4))
with(browsers,
     donuts(share, browser, sprintf('%s: %s%%', version, share),
            col = c('cyan2','red','orange','green','dodgerblue2'))
)

with(mtcars,
     donuts(mpg, interaction(gear, cyl), rownames(mtcars))
)
Original post
vous n'avez pas la fonction givemedonutsorgivemedeath ? Les graphismes de Base sont toujours bien joué pour des choses très détaillées comme ça. Je ne pouvais pas penser à une façon élégante de tracer les étiquettes de tarte centre, cependant.
givemedonutsorgivemedeath('~/desktop/donuts.pdf')
Donne-moi
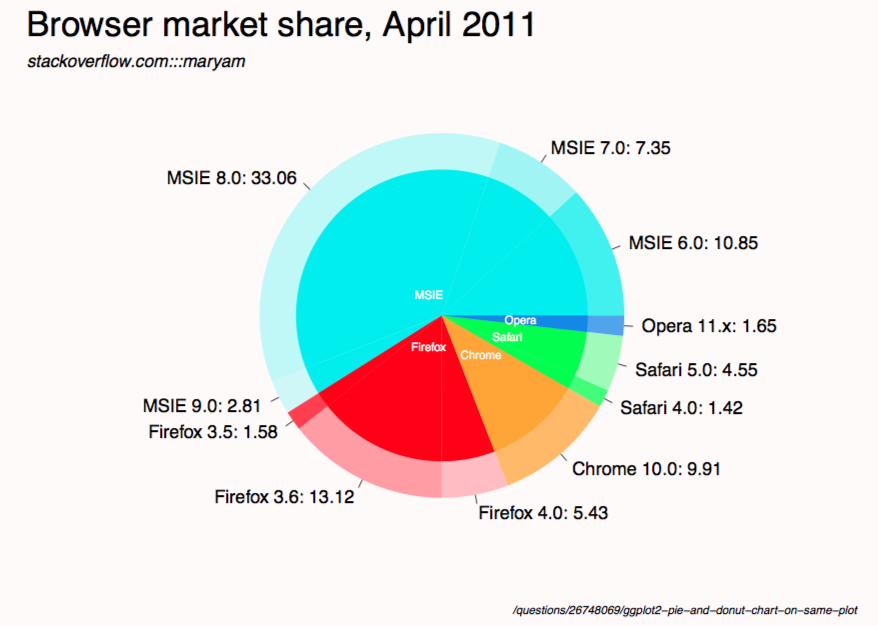
notez que dans ?pie vous voyez
Pie charts are a very bad way of displaying information.
code:
browsers <- structure(list(browser = structure(c(3L, 3L, 3L, 3L, 2L, 2L,
  2L, 1L, 5L, 5L, 4L), .Label = c("Chrome", "Firefox", "MSIE",
  "Opera", "Safari"), class = "factor"), version = structure(c(5L,
  6L, 7L, 8L, 2L, 3L, 4L, 1L, 10L, 11L, 9L), .Label = c("Chrome 10.0",
  "Firefox 3.5", "Firefox 3.6", "Firefox 4.0", "MSIE 6.0", "MSIE 7.0",
  "MSIE 8.0", "MSIE 9.0", "Opera 11.x", "Safari 4.0", "Safari 5.0"),
  class = "factor"), share = c(10.85, 7.35, 33.06, 2.81, 1.58,
  13.12, 5.43, 9.91, 1.42, 4.55, 1.65), ymax = c(10.85, 18.2, 51.26,
  54.07, 55.65, 68.77, 74.2, 84.11, 85.53, 90.08, 91.73), ymin = c(0,
  10.85, 18.2, 51.26, 54.07, 55.65, 68.77, 74.2, 84.11, 85.53,
  90.08)), .Names = c("browser", "version", "share", "ymax", "ymin"),
  row.names = c(NA, -11L), class = "data.frame")

browsers$total <- with(browsers, ave(share, browser, FUN = sum))

givemedonutsorgivemedeath <- function(file, width = 15, height = 11) {
  ## house keeping
  if (missing(file)) file <- getwd()
  plot.new(); op <- par(no.readonly = TRUE); on.exit(par(op))

  pdf(file, width = width, height = height, bg = 'snow')

  ## useful values and colors to work with
  ## each group will have a specific color
  ## each subgroup will have a specific shade of that color
  nr <- nrow(browsers)
  width <- max(sqrt(browsers$share)) / 0.8

  tbl <- with(browsers, table(browser)[order(unique(browser))])
  cols <- c('cyan2','red','orange','green','dodgerblue2')
  cols <- unlist(Map(rep, cols, tbl))

  ## loop creates pie slices
  plot.new()
  par(omi = c(0.5,0.5,0.75,0.5), mai = c(0.1,0.1,0.1,0.1), las = 1)
  for (i in 1:nr) {
    par(new = TRUE)

    ## create color/shades
    rgb <- col2rgb(cols[i])
    f0 <- rep(NA, nr)
    f0[i] <- rgb(rgb[1], rgb[2], rgb[3], 190 / sequence(tbl)[i], maxColorValue = 255)

    ## stick labels on the outermost section
    lab <- with(browsers, sprintf('%s: %s', version, share))
    if (with(browsers, share[i] == max(share))) {
      lab0 <- lab
    } else lab0 <- NA

    ## plot the outside pie and shades of subgroups
    pie(browsers$share, border = NA, radius = 5 / width, col = f0,
        labels = lab0, cex = 1.8)

    ## repeat above for the main groups
    par(new = TRUE)
    rgb <- col2rgb(cols[i])
    f0[i] <- rgb(rgb[1], rgb[2], rgb[3], maxColorValue = 255)

    pie(browsers$share, border = NA, radius = 4 / width, col = f0, labels = NA)
  }

  ## extra labels on graph

  ## center labels, guess and check?
  text(x = c(-.05, -.05, 0.15, .25, .3), y = c(.08, -.12, -.15, -.08, -.02),
       labels = unique(browsers$browser), col = 'white', cex = 1.2)

  mtext('Browser market share, April 2011', side = 3, line = -1, adj = 0,
        cex = 3.5, outer = TRUE)
  mtext('stackoverflow.com:::maryam', side = 3, line = -3.6, adj = 0,
        cex = 1.75, outer = TRUE, font = 3)
  mtext('/questions/26748069/ggplot2-pie-and-donut-chart-on-same-plot',
        side = 1, line = 0, adj = 1.0, cex = 1.2, outer = TRUE, font = 3)
  dev.off()
}

givemedonutsorgivemedeath('~/desktop/donuts.pdf')
Modifier 1
width <- 5

tbl <- table(browsers$browser)[order(unique(browsers$browser))]
col.main <- Map(rep, seq_along(tbl), tbl)
col.sub  <- lapply(col.main, function(x)
  Vectorize(adjustcolor)(x, alpha.f = seq_along(x) / length(x)))

plot.new()

par(new = TRUE)
pie(browsers$share, border = NA, radius = 5 / width,
    col = unlist(col.sub), labels = browsers$version)

par(new = TRUE)
pie(browsers$share, border = NA, radius = 4 / width,
    col = unlist(col.main), labels = NA)
j'ai créé une fonction de tracé de donuts à usage général pour faire ceci, qui pourrait
- dessiner un diagramme circulaire, C. à d. dessiner un diagramme circulaire pour
panelet colorer chaque secteur circulaire par un pourcentage donné de colspctretcolors. La largeur de l'anneau pourrait être réglée paroutradius>radius>innerradius. - Superposition de plusieurs anneau intrigue.
la fonction principale dessine effectivement une barre le graphique et le plier en un anneau, donc c'est quelque chose entre un camembert et un graphique à barres.
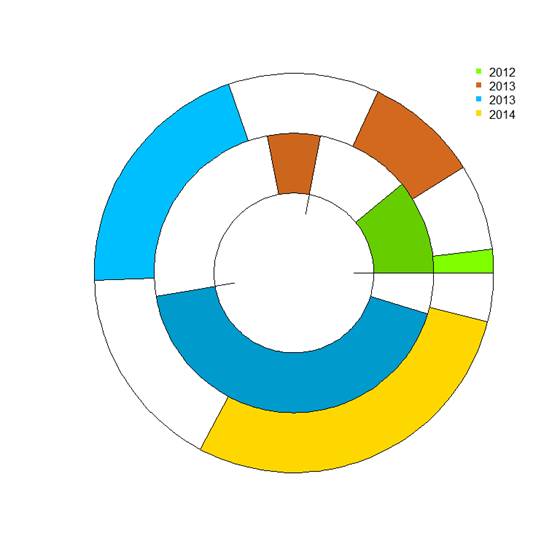
exemple de diagramme circulaire, deux anneaux:
"151970920 Navigateur" Camembertdonuts_plot <- function(
panel = runif(3), # counts
pctr = c(.5,.2,.9), # percentage in count
legend.label='',
cols = c('chartreuse', 'chocolate','deepskyblue'), # colors
outradius = 1, # outter radius
radius = .7, # 1-width of the donus
add = F,
innerradius = .5, # innerradius, if innerradius==innerradius then no suggest line
legend = F,
pilabels=F,
legend_offset=.25, # non-negative number, legend right position control
borderlit=c(T,F,T,T)
){
par(new=add)
if(sum(legend.label=='')>=1) legend.label=paste("Series",1:length(pctr))
if(pilabels){
pie(panel, col=cols,border = borderlit[1],labels = legend.label,radius = outradius)
}
panel = panel/sum(panel)
pctr2= panel*(1 - pctr)
pctr3 = c(pctr,pctr)
pctr_indx=2*(1:length(pctr))
pctr3[pctr_indx]=pctr2
pctr3[-pctr_indx]=panel*pctr
cols_fill = c(cols,cols)
cols_fill[pctr_indx]='white'
cols_fill[-pctr_indx]=cols
par(new=TRUE)
pie(pctr3, col=cols_fill,border = borderlit[2],labels = '',radius = outradius)
par(new=TRUE)
pie(panel, col='white',border = borderlit[3],labels = '',radius = radius)
par(new=TRUE)
pie(1, col='white',border = borderlit[4],labels = '',radius = innerradius)
if(legend){
# par(mar=c(5.2, 4.1, 4.1, 8.2), xpd=TRUE)
legend("topright",inset=c(-legend_offset,0),legend=legend.label, pch=rep(15,'.',length(pctr)),
col=cols,bty='n')
}
par(new=FALSE)
}
## col- > subcor(change hue/alpha)
subcolors <- function(.dta,main,mainCol){
tmp_dta = cbind(.dta,1,'col')
tmp1 = unique(.dta[[main]])
for (i in 1:length(tmp1)){
tmp_dta$"col"[.dta[[main]] == tmp1[i]] = mainCol[i]
}
u <- unlist(by(tmp_dta$"1",tmp_dta[[main]],cumsum))
n <- dim(.dta)[1]
subcol=rep(rgb(0,0,0),n);
for(i in 1:n){
t1 = col2rgb(tmp_dta$col[i])/256
subcol[i]=rgb(t1[1],t1[2],t1[3],1/(1+u[i]))
}
return(subcol);
}
### Then get the plot is fairly easy:
# INPUT data
browsers <- structure(list(browser = structure(c(3L, 3L, 3L, 3L, 2L, 2L,
2L, 1L, 5L, 5L, 4L),
.Label = c("Chrome", "Firefox", "MSIE","Opera", "Safari"),class = "factor"),
version = structure(c(5L,6L, 7L, 8L, 2L, 3L, 4L, 1L, 10L, 11L, 9L),
.Label = c("Chrome 10.0", "Firefox 3.5", "Firefox 3.6", "Firefox 4.0", "MSIE 6.0",
"MSIE 7.0","MSIE 8.0", "MSIE 9.0", "Opera 11.x", "Safari 4.0", "Safari 5.0"),
class = "factor"),
share = c(10.85, 7.35, 33.06, 2.81, 1.58,13.12, 5.43, 9.91, 1.42, 4.55, 1.65),
ymax = c(10.85, 18.2, 51.26,54.07, 55.65, 68.77, 74.2, 84.11, 85.53, 90.08, 91.73),
ymin = c(0,10.85, 18.2, 51.26, 54.07, 55.65, 68.77, 74.2, 84.11, 85.53,90.08)),
.Names = c("browser", "version", "share", "ymax", "ymin"),
row.names = c(NA, -11L), class = "data.frame")
## data clean
browsers=browsers[order(browsers$browser,browsers$share),]
arr=aggregate(share~browser,browsers,sum)
### choose your cols
mainCol = c('chartreuse3', 'chocolate3','deepskyblue3','gold3','deeppink3')
donuts_plot(browsers$share,rep(1,11),browsers$version,
cols=subcolors(browsers,"browser",mainCol),
legend=F,pilabels = T,borderlit = rep(F,4) )
donuts_plot(arr$share,rep(1,5),arr$browser,
cols=mainCol,pilabels=F,legend=T,legend_offset=-.02,
outradius = .71,radius = .0,innerradius=.0,add=T,
borderlit = rep(F,4) )
###end of line
@rawr la solution est vraiment sympa, toutefois, les étiquettes seront superposées si elles sont trop nombreuses. Inspiré par @user3969377 et @FlorianGD , j'ai obtenu une nouvelle solution en utilisant ggplot2 et ggrepel .
1. préparer des données
browsers$ymax <- cumsum(browsers$share) # fed to geom_rect() in piedonut()
browsers$ymin <- browsers$ymax - browsers$share # fed to geom_rect() in piedonut()

browsers$share_browser <- sum(browsers$share[browsers$browser == unique(browsers$browser)[1]]) # "_browser" means at browser level
browsers$ymax_browser <- browsers$share_browser[browsers$browser == unique(browsers$browser)[1]][1]
for (z in 2:length(unique(browsers$browser))) {
  browsers$share_browser[browsers$browser == unique(browsers$browser)[z]] <- sum(browsers$share[browsers$browser == unique(browsers$browser)[z]])
  browsers$ymax_browser[browsers$browser == unique(browsers$browser)[z]] <- browsers$ymax_browser[browsers$browser == unique(browsers$browser)[z-1]][1] + browsers$share_browser[browsers$browser == unique(browsers$browser)[z]][1]
}
browsers$ymin_browser <- browsers$ymax_browser - browsers$share_browser
2. Ecrire la fonction piedonut
piedonut <- function(data, cols = c('cyan2','red','orange','green','dodgerblue2'), force = 80, nudge_x = 3, nudge_y = 10) { # force, nudge_x, nudge_y are parameters to fine tune positions of the labels by geom_label_repel.
  nr <- nrow(data)
  # width <- max(sqrt(data$share)) / 0.1

  tbl <- with(data, table(browser)[order(unique(browser))])
  cols <- unlist(Map(rep, cols, tbl))
  col_subnum <- unlist(Map(rep, 255/tbl,tbl))

  col <- rep(NA, nr)
  col_browser <- rep(NA, nr)
  for (i in 1:nr) {
    ## create color/shades
    rgb <- col2rgb(cols[i])
    col[i] <- rgb(rgb[1], rgb[2], rgb[3],  col_subnum[i]*sequence(tbl)[i], maxColorValue = 255)

    rgb <- col2rgb(cols[i])
    col_browser[i] <- rgb(rgb[1], rgb[2], rgb[3], maxColorValue = 255)
  }
  #col
  # set labels positions
  x.breaks <- seq(1, 1.8, length.out = nr)
  y.breaks <- cumsum(data$share)-data$share/2
  ggplot(data) +
    geom_rect(aes(ymax = ymax, ymin = ymin, xmax=4, xmin=1), fill=col) +
    geom_rect(aes(ymax=ymax_browser, ymin=ymin_browser, xmax=1, xmin=0), fill=col_browser) +
    coord_polar(theta = 'y') +
    theme(axis.ticks = element_blank(),
          axis.title = element_blank(),
          axis.text = element_blank(),
          panel.grid = element_blank(),
          panel.background = element_blank()) +
    geom_label_repel(aes(x = x.breaks, y = y.breaks, label = sprintf("%s: %s%%",data$version, data$share)),
                     force = force,
                     nudge_x = nudge_x,
                     nudge_y = nudge_y)
}
3. obtenir le piedonut
cols <- c('cyan2','red','orange','green','dodgerblue2')

pdf('~/Downloads/donuts.pdf', width = 10, height = 10, bg = "snow")
par(omi = c(0.5,0.5,0.75,0.5), mai = c(0.1,0.1,0.1,0.1), las = 1)
print(piedonut(data = browsers, cols = cols, force = 80, nudge_x = 3, nudge_y = 10))
dev.off()
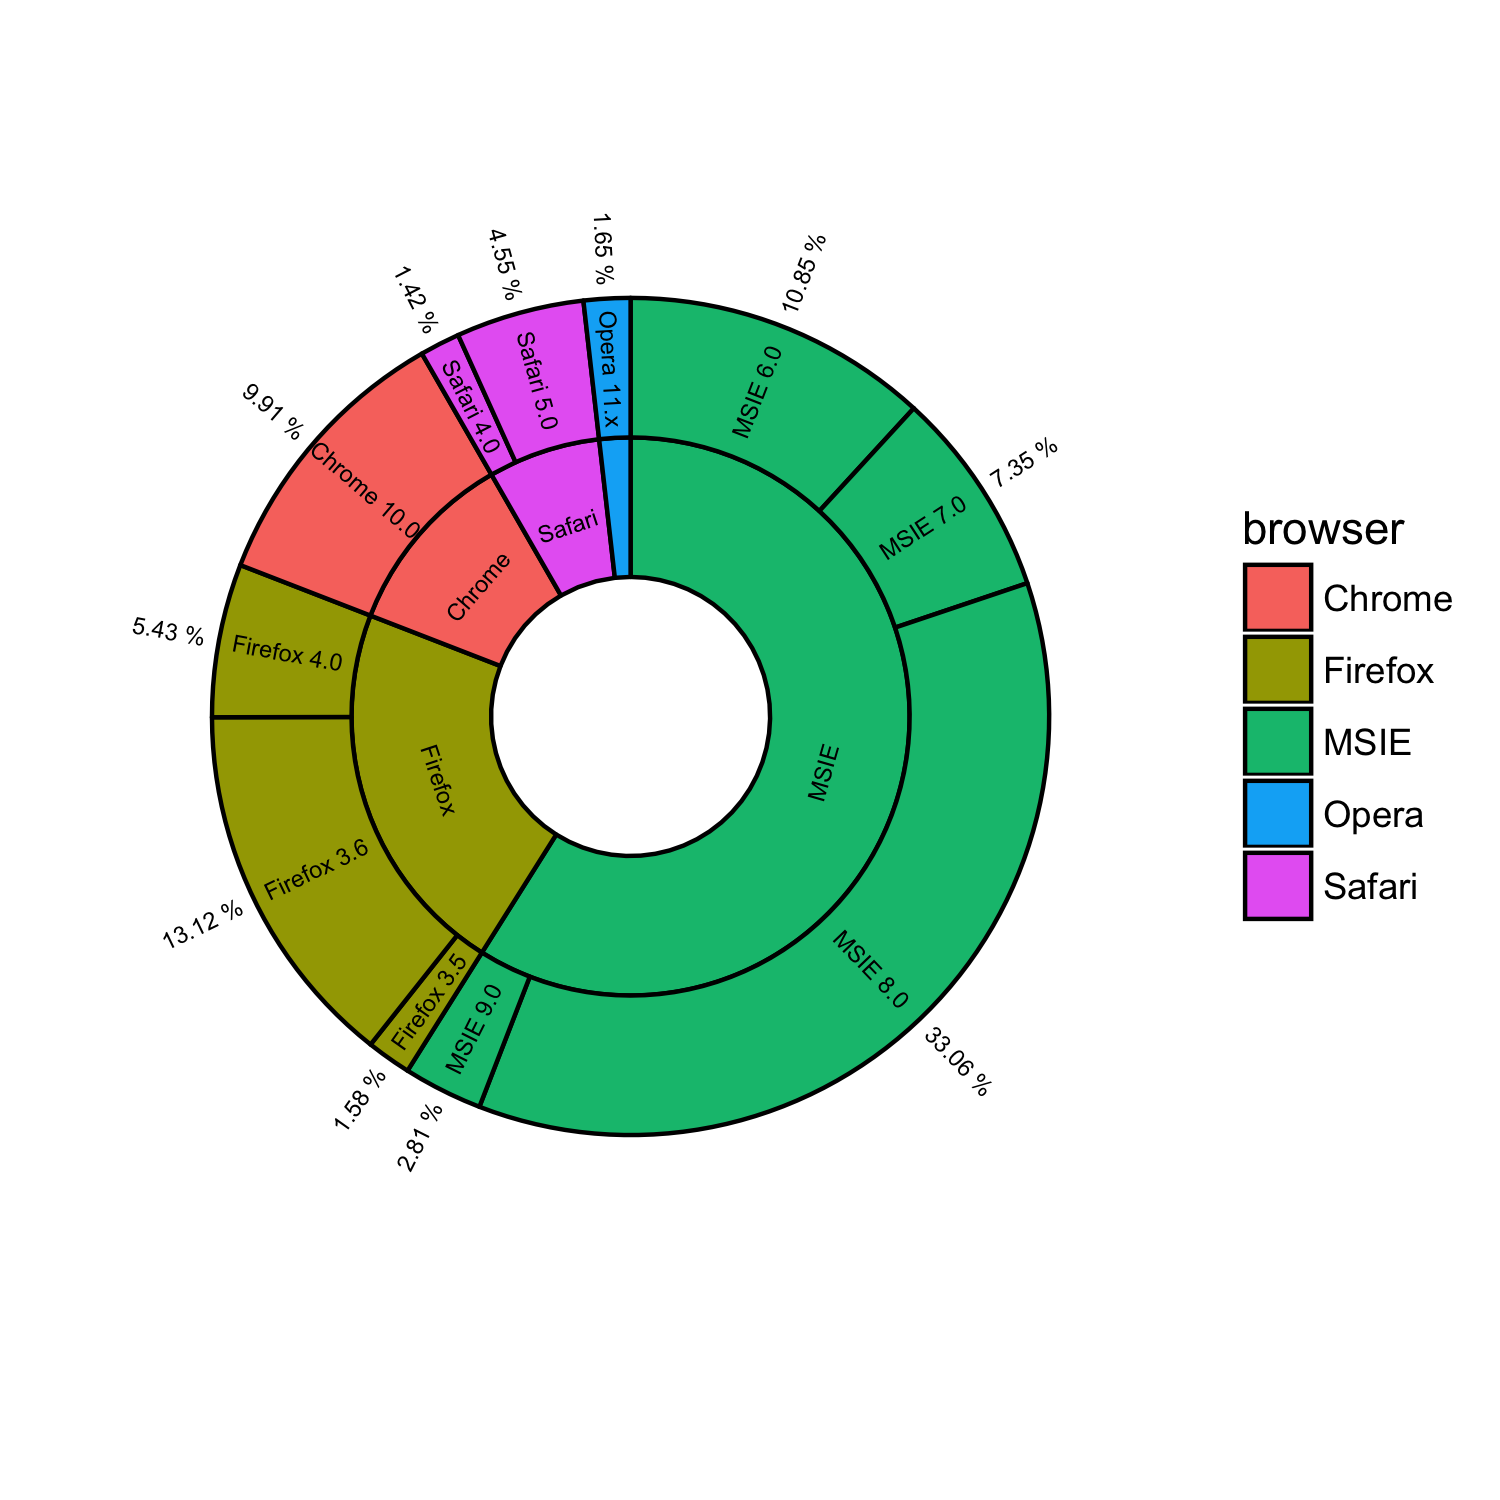
vous pouvez obtenir quelque chose de similaire en utilisant le paquet ggsunburst
# using your data without "ymax" and "ymin"
browsers <- structure(list(browser = structure(c(3L, 3L, 3L, 3L, 2L, 2L,
2L, 1L, 5L, 5L, 4L), .Label = c("Chrome", "Firefox", "MSIE",
"Opera", "Safari"), class = "factor"), version = structure(c(5L,
6L, 7L, 8L, 2L, 3L, 4L, 1L, 10L, 11L, 9L), .Label = c("Chrome 10.0",
"Firefox 3.5", "Firefox 3.6", "Firefox 4.0", "MSIE 6.0", "MSIE 7.0",
"MSIE 8.0", "MSIE 9.0", "Opera 11.x", "Safari 4.0", "Safari 5.0"
), class = "factor"), share = c(10.85, 7.35, 33.06, 2.81, 1.58,
13.12, 5.43, 9.91, 1.42, 4.55, 1.65)), .Names = c("parent", "node", "size")
, row.names = c(NA, -11L), class = "data.frame")

# add column browser to be used for colouring
browsers$browser <- browsers$parent

# write data.frame into csv file
write.table(browsers, file = 'browsers.csv', row.names = F, sep = ",")

# install ggsunburst
if (!require("ggplot2")) install.packages("ggplot2")
if (!require("rPython")) install.packages("rPython")
install.packages("http://genome.crg.es/~didac/ggsunburst/ggsunburst_0.0.9.tar.gz", repos=NULL, type="source")
library(ggsunburst)

# generate data structure
sb <- sunburst_data('browsers.csv', type = 'node_parent', sep = ",", node_attributes = c("browser","size"))

# add name as browser attribute for colouring to internal nodes
sb$rects[!sb$rects$leaf,]$browser <- sb$rects[!sb$rects$leaf,]$name

# plot adding geom_text layer for showing the "size" value
p <- sunburst(sb, rects.fill.aes = "browser", node_labels = T, node_labels.min = 15)
p + geom_text(data = sb$leaf_labels,
    aes(x=x, y=0.1, label=paste(size,"%"), angle=angle, hjust=hjust), size = 2)
