cercles de dessin sur l'image avec matplotlib et numpy
j'ai float x/y des tableaux qui détiennent cercle centres.
import matplotlib.pylab as plt
import numpy as np
npX = np.asarray(X)
npY = np.asarray(Y)
plt.imshow(img)
// TO-DO
plt.show()
je veux montrer des cercles sur mon image en utilisant ces centres. Comment puis-je y parvenir?
9
demandé sur
tom
2016-01-20 17:17:18
1 réponses
vous pouvez le faire avec le matplotlib.patches.Circle patch.
pour votre exemple, nous devons boucler les tableaux X et Y, puis créer un patch de cercle pour chaque coordonnée.
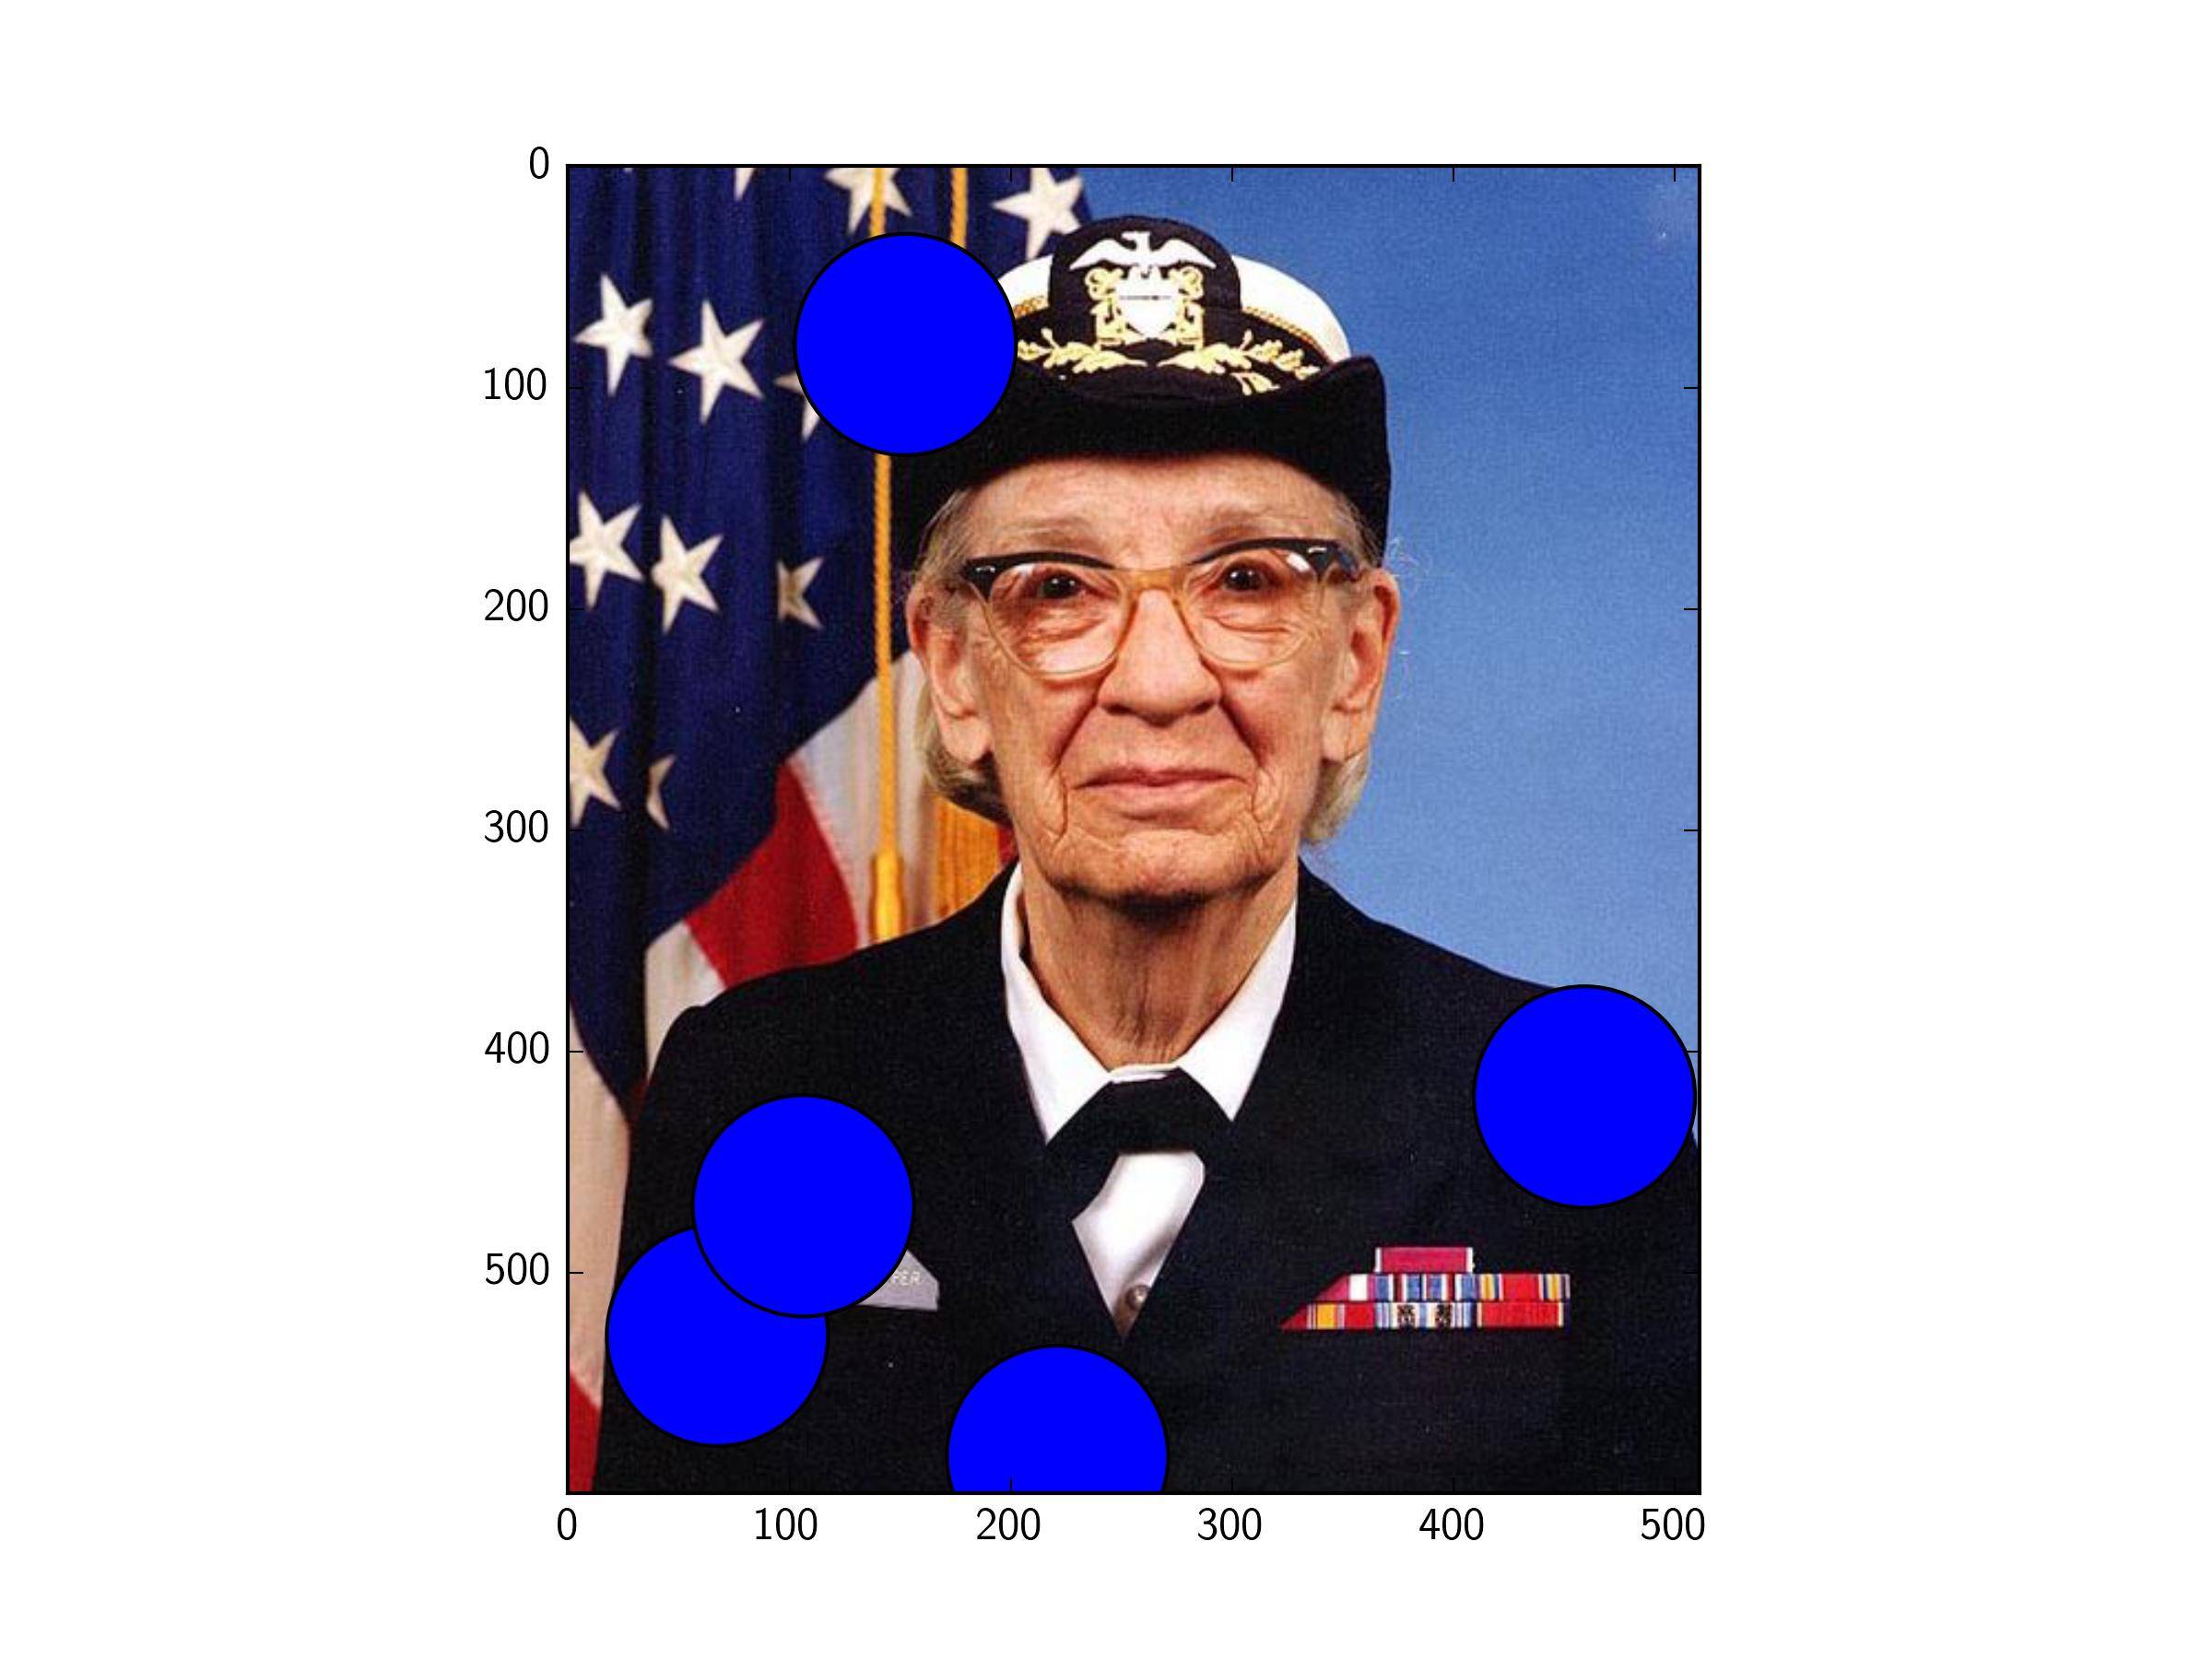
voici un exemple de cercle placé au-dessus d'une image (à partir du matplotlib.cbook)
import matplotlib.pyplot as plt
import numpy as np
from matplotlib.patches import Circle

# Get an example image
import matplotlib.cbook as cbook
image_file = cbook.get_sample_data('grace_hopper.png')
img = plt.imread(image_file)

# Make some example data
x = np.random.rand(5)*img.shape[1]
y = np.random.rand(5)*img.shape[0]

# Create a figure. Equal aspect so circles look circular
fig,ax = plt.subplots(1)
ax.set_aspect('equal')

# Show the image
ax.imshow(img)

# Now, loop through coord arrays, and create a circle at each x,y pair
for xx,yy in zip(x,y):
    circ = Circle((xx,yy),50)
    ax.add_patch(circ)

# Show the image
plt.show()
14
répondu
tom
2016-01-20 16:36:54