Peut-on obtenir des graphiques hiérarchiques à partir de networkx avec python 3?
j'essaie d'afficher un graphique arborescent de ma hiérarchie de classe en utilisant networkx. j'ai tout de dessiner correctement, et il affiche fine. Mais comme un graphique circulaire avec la traversée des arêtes, c'est un pur hiérarchie, et il semble que je devrais être en mesure de l'afficher comme un arbre.
j'ai beaucoup cherché sur Google, et chaque solution proposée implique d'utiliser pygraphviz... mais PyGraphviz ne fonctionne pas avec Python 3 (documentation de la site de pygraphviz).
quelqu'un a-t-il pu obtenir un affichage de graphe arborescent en Python 3?
5 réponses
modifier (27 Août 2018) si vous voulez créer un graphe avec les noeuds apparaissant comme des anneaux autour du noeud racine, le code en bas montre une simple modification pour le faire
modifier (17 Septembre 2017) je crois que le problème avec pygraphviz que L'OP avait devrait être réglé maintenant. Donc pygraphviz est probablement une meilleure solution que ce que j'ai en dessous.
voici un programme récursif simple pour définir positions:
import networkx as nx

def hierarchy_pos(G, root, width=1., vert_gap = 0.2, vert_loc = 0, xcenter = 0.5,
                  pos = None, parent = None):
    '''If there is a cycle that is reachable from root, then this will see infinite recursion.
       G: the graph
       root: the root node of current branch
       width: horizontal space allocated for this branch - avoids overlap with other branches
       vert_gap: gap between levels of hierarchy
       vert_loc: vertical location of root
       xcenter: horizontal location of root
       pos: a dict saying where all nodes go if they have been assigned
       parent: parent of this branch.'''
    if pos == None:
        pos = {root:(xcenter,vert_loc)}
    else:
        pos[root] = (xcenter, vert_loc)
    neighbors = list(G.neighbors(root))
    if parent != None:   #this should be removed for directed graphs.
        neighbors.remove(parent)  #if directed, then parent not in neighbors.
    if len(neighbors)!=0:
        dx = width/len(neighbors)
        nextx = xcenter - width/2 - dx/2
        for neighbor in neighbors:
            nextx += dx
            pos = hierarchy_pos(G,neighbor, width = dx, vert_gap = vert_gap,
                                vert_loc = vert_loc-vert_gap, xcenter=nextx, pos=pos,
                                parent = root)
    return pos
et un exemple d'utilisation:
import matplotlib.pyplot as plt
import networkx as nx
G=nx.Graph()
G.add_edges_from([(1,2), (1,3), (1,4), (2,5), (2,6), (2,7), (3,8), (3,9), (4,10),
                  (5,11), (5,12), (6,13)])
pos = hierarchy_pos(G,1)
nx.draw(G, pos=pos, with_labels=True)
plt.savefig('hierarchy.png')
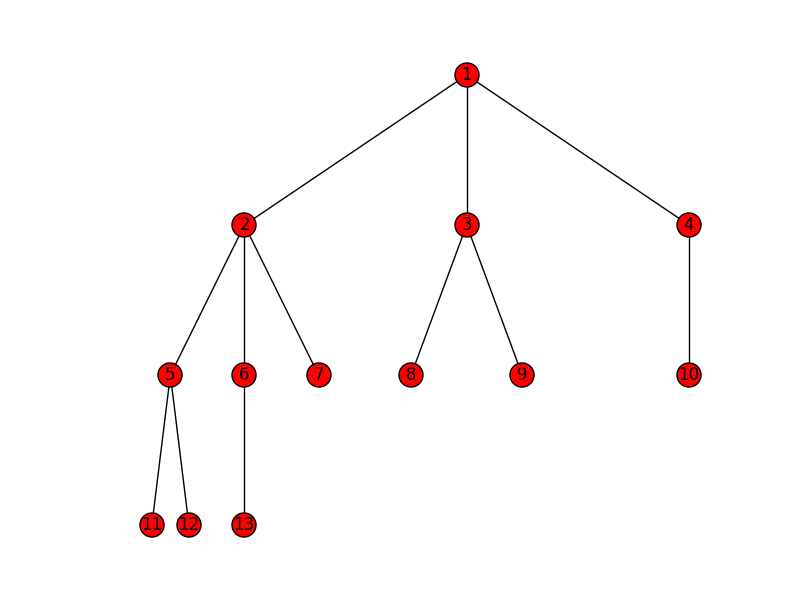
idéalement, cela devrait modifier la séparation horizontale en fonction de la largeur des choses. Je ne vais pas tenter ça maintenant.
expansion radiale
disons que vous voulez l'intrigue ressemble à:
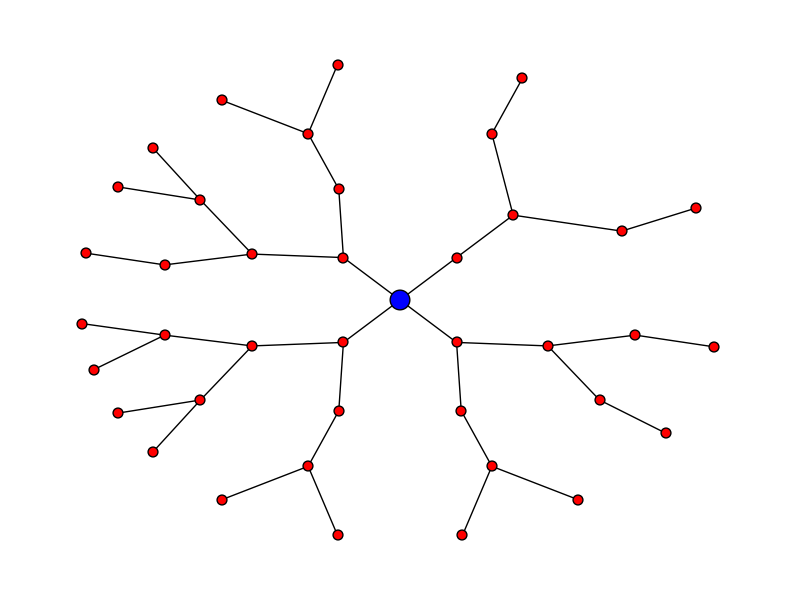
Voici le code pour que:
pos = hierarchy_pos(G, 0, width = 2*math.pi, xcenter=0)
new_pos = {u:(r*math.cos(theta),r*math.sin(theta)) for u, (theta, r) in pos.items()}
nx.draw(G, pos=new_pos, node_size = 50)
nx.draw_networkx_nodes(G, pos=new_pos, nodelist = [0], node_color = 'blue', node_size = 200)
modifier - merci à Deepak Saini pour avoir noté une erreur qui se produit dans les graphiques dirigés (les commentaires dans le code d'exemple montrent maintenant comment corriger cela)
j'ai légèrement modifié pour qu'il ne se reproduise pas indéfiniment.
import networkx as nx

def hierarchy_pos(G, root, width=1., vert_gap = 0.2, vert_loc = 0, xcenter = 0.5 ):
    '''If there is a cycle that is reachable from root, then result will not be a hierarchy.

       G: the graph
       root: the root node of current branch
       width: horizontal space allocated for this branch - avoids overlap with other branches
       vert_gap: gap between levels of hierarchy
       vert_loc: vertical location of root
       xcenter: horizontal location of root
    '''

    def h_recur(G, root, width=1., vert_gap = 0.2, vert_loc = 0, xcenter = 0.5,
                  pos = None, parent = None, parsed = [] ):
        if(root not in parsed):
            parsed.append(root)
            if pos == None:
                pos = {root:(xcenter,vert_loc)}
            else:
                pos[root] = (xcenter, vert_loc)
            neighbors = G.neighbors(root)
            if parent != None:
                neighbors.remove(parent)
            if len(neighbors)!=0:
                dx = width/len(neighbors)
                nextx = xcenter - width/2 - dx/2
                for neighbor in neighbors:
                    nextx += dx
                    pos = h_recur(G,neighbor, width = dx, vert_gap = vert_gap,
                                        vert_loc = vert_loc-vert_gap, xcenter=nextx, pos=pos,
                                        parent = root, parsed = parsed)
        return pos

    return h_recur(G, root, width=1., vert_gap = 0.2, vert_loc = 0, xcenter = 0.5)
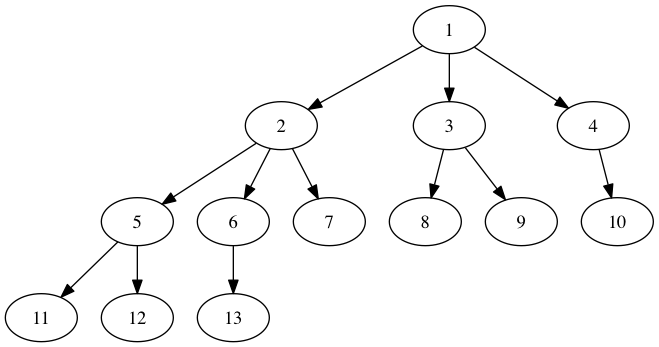
la façon la plus simple d'obtenir un bel affichage de graphe arborescent en Python 2 ou 3 sans PyGraphviz est D'utiliser PyDot (https://pypi.python.org/pypi/pydot). Tandis que PyGraphviz fournit une interface à L'ensemble de Graphviz, PyDot fournit seulement une interface à L'outil point de Graphviz, qui est le seul dont vous avez besoin si ce que vous recherchez est un graphe hiérarchique / un arbre. Si vous voulez créer votre graphique dans NetworkX plutôt que PyDot, vous pouvez utiliser NetworkX pour exporter un graphique PyDot, comme dans le code suivant:
import networkx as nx

g=nx.DiGraph()
g.add_edges_from([(1,2), (1,3), (1,4), (2,5), (2,6), (2,7), (3,8), (3,9),
                  (4,10), (5,11), (5,12), (6,13)])
p=nx.drawing.nx_pydot.to_pydot(g)
p.write_png('example.png')
notez que Graphviz et PyDot doivent être installés pour que ce qui précède fonctionne correctement.
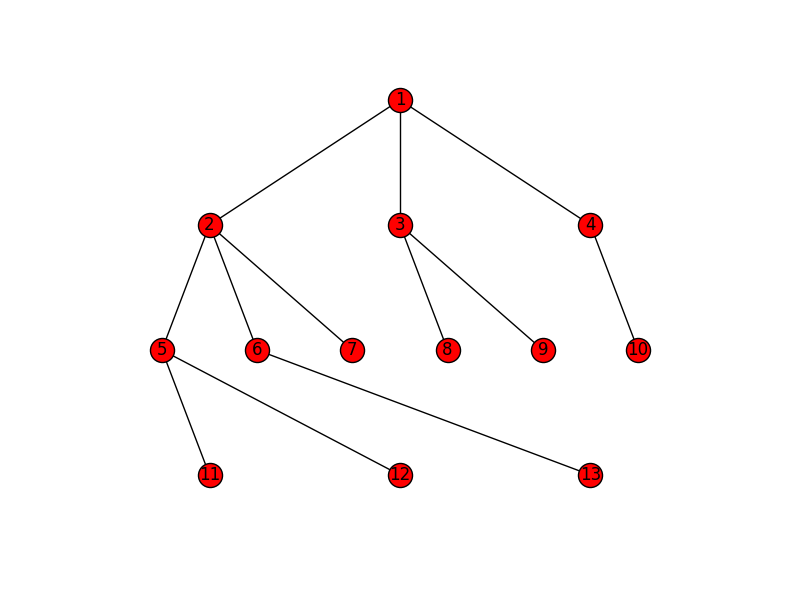
Voici une solution pour les grands arbres. Il s'agit d'une modification de L'approche récursive de Joël qui permet d'espacer uniformément les noeuds à chaque niveau.
def hierarchy_pos(G, root, levels=None, width=1., height=1.):
    '''If there is a cycle that is reachable from root, then this will see infinite recursion.
       G: the graph
       root: the root node
       levels: a dictionary
               key: level number (starting from 0)
               value: number of nodes in this level
       width: horizontal space allocated for drawing
       height: vertical space allocated for drawing'''
    TOTAL = "total"
    CURRENT = "current"
    def make_levels(levels, node=root, currentLevel=0, parent=None):
        """Compute the number of nodes for each level
        """
        if not currentLevel in levels:
            levels[currentLevel] = {TOTAL : 0, CURRENT : 0}
        levels[currentLevel][TOTAL] += 1
        neighbors = G.neighbors(node)
        if parent is not None:
            neighbors.remove(parent)
        for neighbor in neighbors:
            levels =  make_levels(levels, neighbor, currentLevel + 1, node)
        return levels

    def make_pos(pos, node=root, currentLevel=0, parent=None, vert_loc=0):
        dx = 1/levels[currentLevel][TOTAL]
        left = dx/2
        pos[node] = ((left + dx*levels[currentLevel][CURRENT])*width, vert_loc)
        levels[currentLevel][CURRENT] += 1
        neighbors = G.neighbors(node)
        if parent is not None:
            neighbors.remove(parent)
        for neighbor in neighbors:
            pos = make_pos(pos, neighbor, currentLevel + 1, node, vert_loc-vert_gap)
        return pos
    if levels is None:
        levels = make_levels({})
    else:
        levels = {l:{TOTAL: levels[l], CURRENT:0} for l in levels}
    vert_gap = height / (max([l for l in levels])+1)
    return make_pos({})
Joël exemple ressemble à ceci:
et ceci est un graphe plus complexe (rendu en utilisant plotly):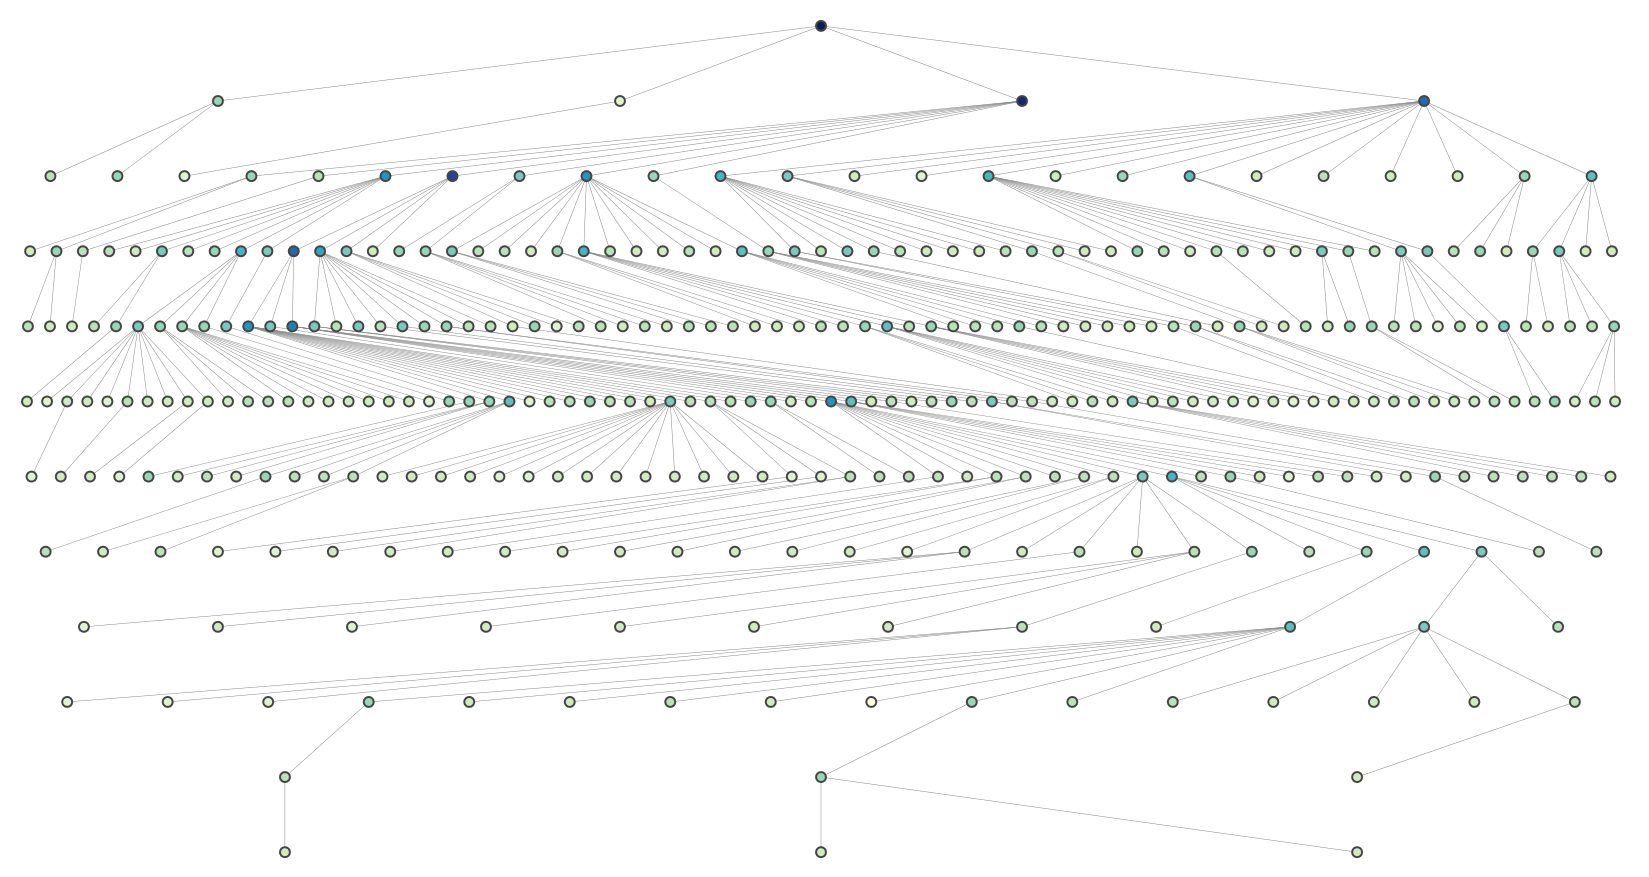
pour un graphique dirigé, puisque neighbors(x) n'inclut que les successeurs (x), vous devez donc supprimer les lignes:
if parent != None:
        neighbors.remove(parent)
aussi, une meilleure option serait celle-ci:
pos=nx.graphviz_layout(G,prog='dot')